Fig. 2.
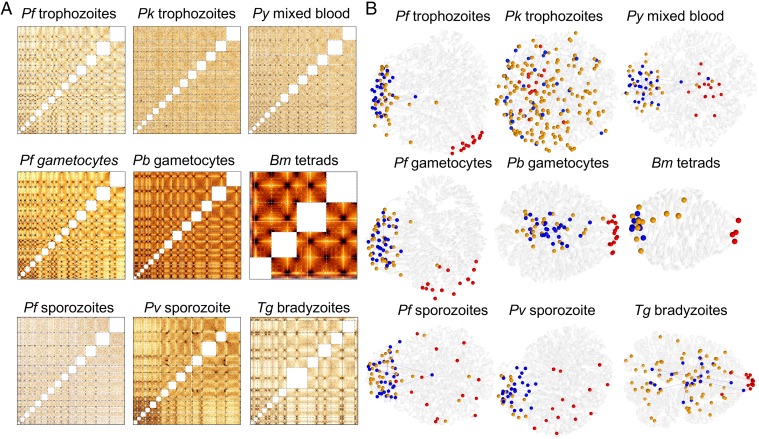
Hi-C data and 3D genome modeling. (A) Normalized interchromosomal contact-count heat maps at 10-kb resolution. Chromosomes are lined up in numerical order starting with chr1 in the bottom left corner. Individual chromosomes are delineated by dashed lines. Intrachromosomal contacts are not displayed, hence the white squares along the diagonal of each heat map. Larger versions of the interchromosomal heat maps as well as all intrachromosomal heat maps are accessible at apicomplexan3d.lji.org/. (B) Representative 3D models for genomes of all organisms studied here. Chromosomes are shown as transparent white ribbons. Centromeres are indicated with red spheres, telomeres with blue spheres, and virulence genes with orange spheres. Representative 3D models for asynchronous B. microti blood stages and T. gondii tachyzoites are shown in SI Appendix, Fig. S2.

