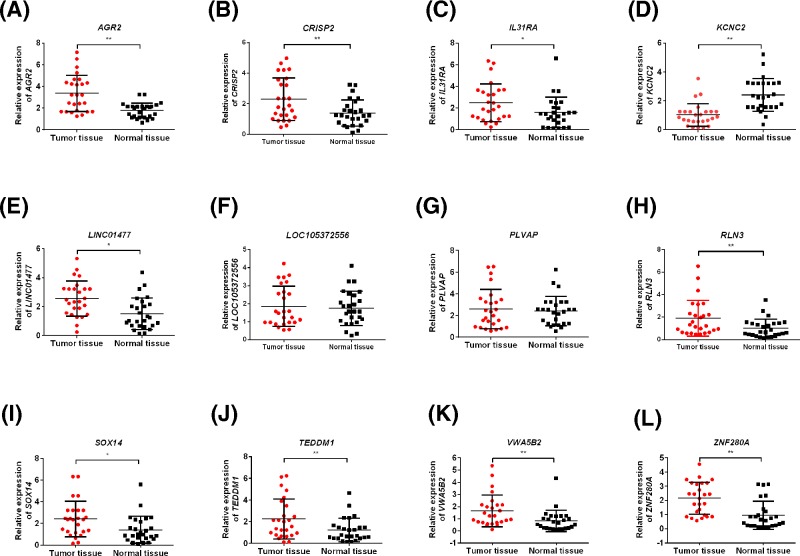
Figure 4. Expressions of genes differentiated the survival differences in HCC in clinical samples.
The expressions of AGR2 (A), CRISP2 (B), IL31RA (C), KCNC2 (D), LINC01477 (E), LOC105372556 (F), PLVAP (G), RLN3 (H), SOX14 (I), TEDDM1 (J), VWA5B2 (K), and ZNF280A (L) in HCC tissues and adjacent normal tissues. Data were shown as mean ± S.D., n=26. *P<0.05 and **P<0.01.

