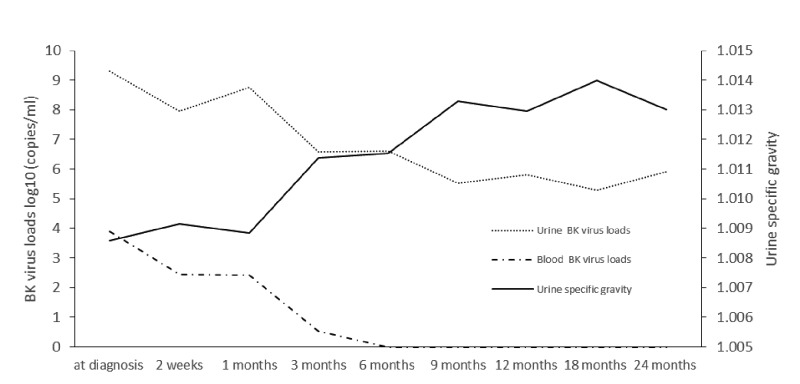
Figure 3. The BKV load in blood and tissues was reduced after switching from tacrolimus to CsA.
The timing and trend of BKV load decrease was consistent with the timing and trend of urine specific gravity increase. After log conversion, the BKV load in blood and urine, and urine specific gravity were expressed as mean.

