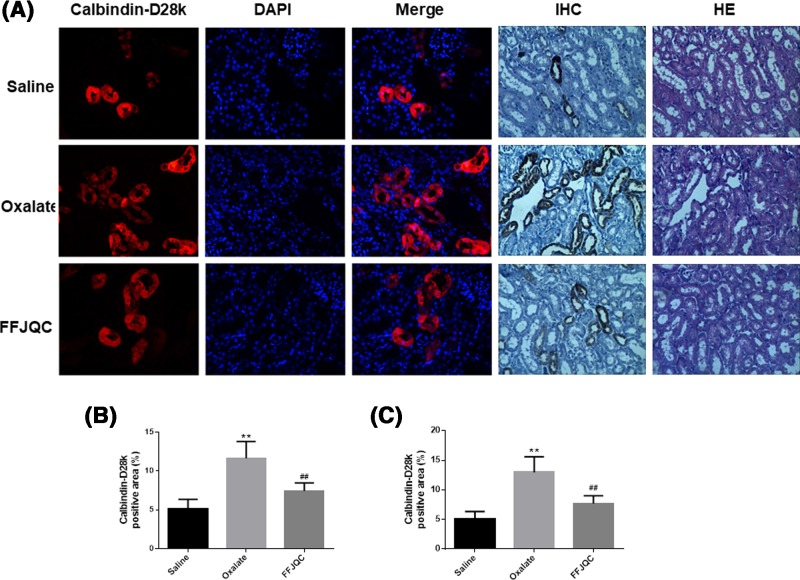
Figure 4. Representative immunofluorescent(IF) and immunohistochemical (IHC) staining of calbindin-D28k at the corticomedullary junction in kidneys.
The calbindin-D28k protein were labeled with red fluorescence and the nuclei were labeled with blue fluorescence. The images were taken under fluorescence microscope-Magnification: 400×, optical microscope-Magnification: 200×. (A) The calbindin-D28k expression level decreased in the oxalate mouse group. After the FFJQC treatment, the calbindin-D28k expression level increased significantly. (B) Quantitation of calbindin-D28k+ area in IF, **P<0.001 Oxalate group compared with Saline group, ##P=0.0015 FFJQC group compared with Oxalate group. (C) Quantitation of calbindin-D28k+ area in IHC, **P<0.001 Oxalate group compared with Saline group, ##P=0.0021 FFJQC group compared with Oxalate group. Twenty specimens were used while calculating the calbindin-positive area.

