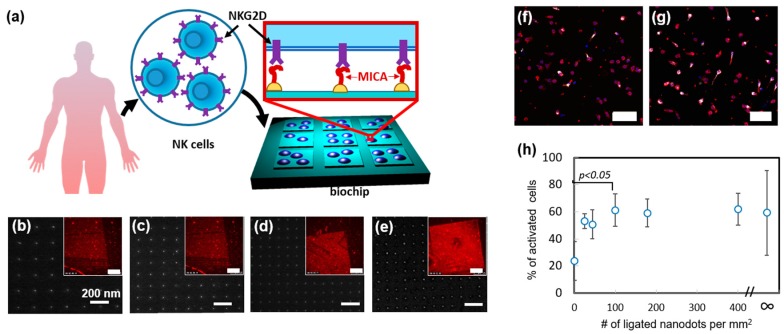
Figure 4.
Nanoimprinted chip for the study of the role of the spatial distribution of activating receptors in the immune activation of NK cells. (a) Scheme of the chip (b–e) SEM images of nanodot in different matrices with the periodicity of 200, 150, 100, and 50 nm, receptively. Scale bar: 200 nm. Insets: Florescent image of the matrices functionalized wit MICA and immunostained with AlexaFluor 568 tagged antibody. Scale bar in insets: 50 µm. (f,g). Fluorescent imaging of CD107a (white) in the NK cells activated on the matrices with 400 nanodots per μm2 and 50 nanodots per μm2, respectively. The cells were also stained for cytoskeleton (red), nuclei (blue). Scale bars: 50 μm (h) % of activated cells vs. the nanodot density. Here ∞ means continues AuPd layer functionalized with MICA, providing the maximal ligand density. Analysis of variance was performed to assess the significant changes in the percentage of activated cells on different matrices. The results were considered significant for p < 0.05. Reproduced from Reference [45] with permission from The Royal Society of Chemistry.

