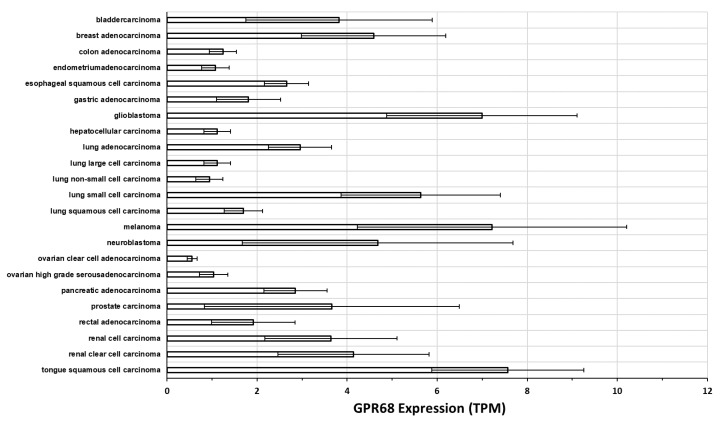
Figure 5.
GPR68 expression in cancer cell lines from a range of tumor types. These data were generated by RNA-seq, quantified in transcripts per million (TPM) and analyzed via the iRAP pipeline [66], from the Cancer Cell Line Encyclopedia [65] accessed via the EMBL-EBI expression atlas. GPR68 expression is plotted as mean and standard error of the mean (SEM) across all cell lines.

