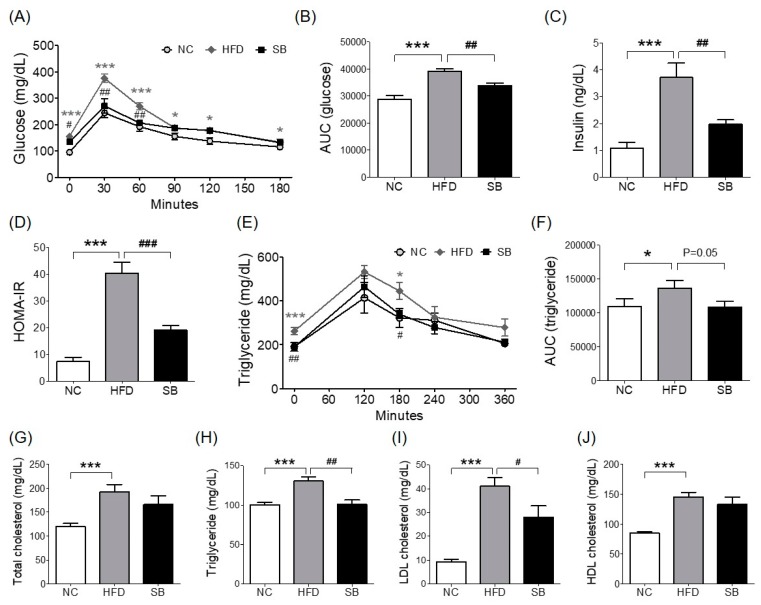
Figure 2.
Effects of SB on oral glucose tolerance test (OGTT) and area under curve (AUC) (A,B), fasting insulin (C), HOMA-IR (D), oral fat tolerance test (OFTT) and area under curve (AUC) (E,F), serum total cholesterol, triglyceride, LDL cholesterol, and HDL cholesterol (G–J). n = 6 in each groups. Data shown as mean ± SEM. * p < 0.05, *** p < 0.001, HFD compared with NC; # p < 0.05, ## p < 0.01, and ### p < 0.001, HFD compared with SB.

