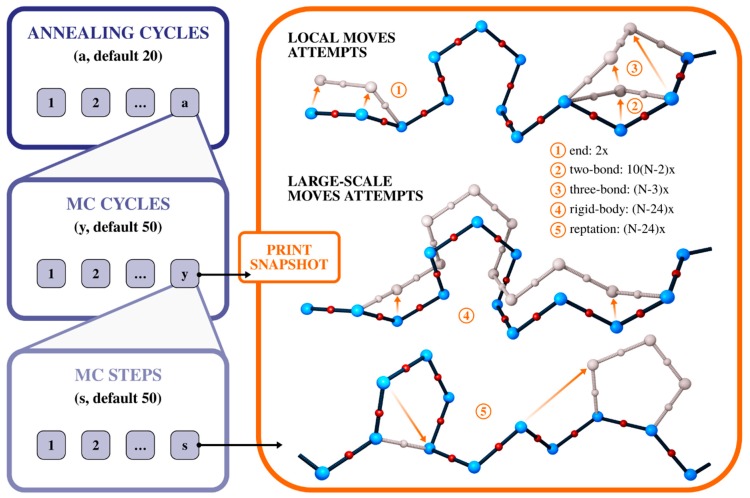
Figure 3.
Sampling scheme of the CABS model. Blue panels show implementation details of Monte Carlo (MC) iterations (loops). The orange panel shows all motions that may be performed in a single MC step. The simulation is organized as a set of nested loops, in which the s number of MC steps is organized into the y number of cycles, and these in a annealing cycles (number of a, y or s cycles can be controlled by the user in CABS-flex and CABS-dock standalone packages [72]). In the orange panel, numbers 1 to 5 denote the available moves, presented together with the number of attempts to perform a move in each of the MC steps. The resulting trajectory is comprised of simulation snapshots saved at the end of each MC cycle.

