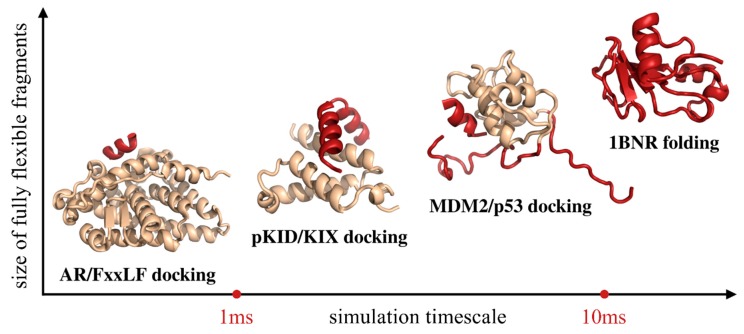
Figure 4.
Presentation of the modeling cases discussed in this work. The modeled systems are arranged according to the size of the fully flexible fragment of the modeled system and the effective timescales required to observe their motions. The regions of the systems that were modeled as fully flexible are marked with red, while the regions in which backbone fluctuations were limited to 1 Å RMSD with beige. The presented millisecond values are approximated up to the order of magnitude.

