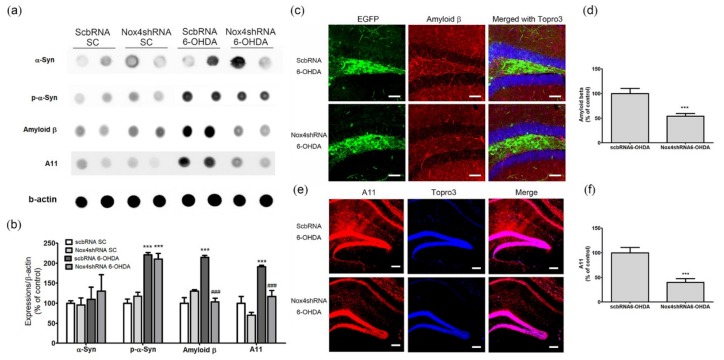
Figure 8.
Inhibition of NOX4 reduced expressions of amyloid β and A11 oligomers in the hippocampus of 6-OHDA-injectecd PD mice. Representative immunoblot analyses of (a) α-syn, p-α-syn, amyloid β, A11 oligomers, and β-actin in the hippocampus of 6-OHDA-injectecd PD mice. (b) All expression levels were quantified using Quantity One software and normalized against β-actin. The results are expressed as a percentage of control. Data are shown as the mean ± SEM. n = 6 per group, *** p < 0.001, vs. Scb shRNA SC; ### p < 0.001 vs. Scb shRNA 6-OHDA. (c) Representative photomicrographs of cells expressing EGFP (green) represent AAV-transduced cells. Scb shRNA or NOX4 shRNA with amyloid β-positive cells is demonstrated by yellow staining after merging green (EGFP) and red (amyloid β) images. Blue colors show the Topro3 nuclear marker. (d) Yellow stained cells were counted and quantified using Quantity One software. The results are expressed as a percentage of control. Data are shown as the mean ± SEM. n = 6. (e) Representative photomicrographs A11 oligomers (red) staining in the hippocampal sections of Scb shRNA 6-OHDA and NOX4 shRNA 6-OHDA mice. Blue colors show the Topro3 nuclear marker. (f) The expression level was quantified using Quantity One software. The results are expressed as a percentage of control. Data are shown as the mean ± SEM. n = 6. *** p < 0.001 vs. Scb shRNA 6-OHDA. SC, sham control; Scb RNA, scrambled shRNA; scale bars = 50 μm.

