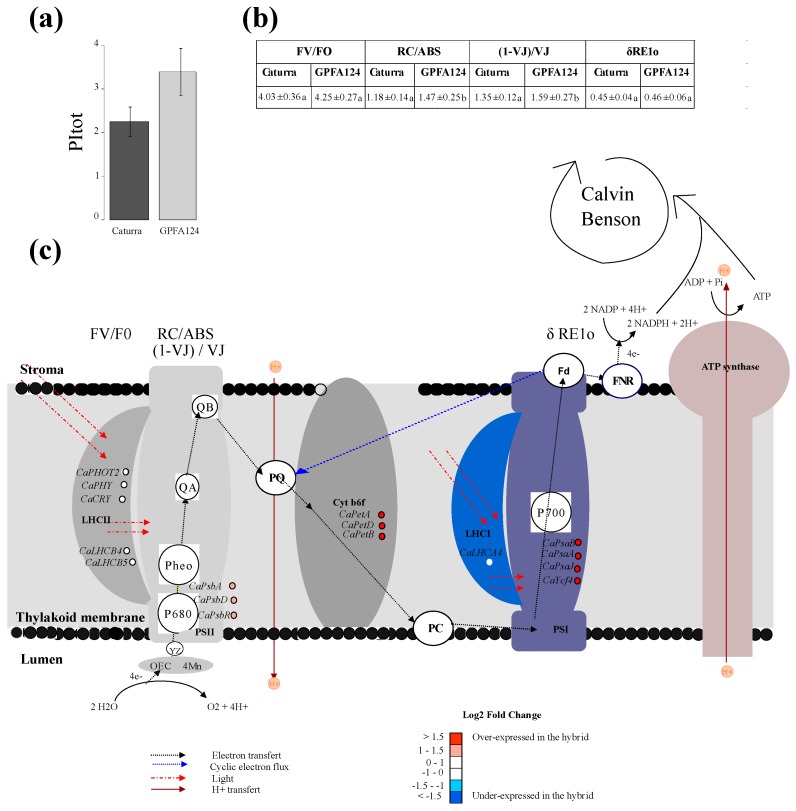
Figure 2.
Study of total performance index in two different C. arabica genotypes. (a) Total performance index (PItotal) at Zeitgeber time 3 (ZT3). Caturra and GPFA124 are in dark and light gray, respectively. (b) Table of fluorescence parameters contributing to the total performance index. Data are means ± SD (n = 12). Different letters indicate significant differences between the two genotypes according to Mann–Whitney–Wilcoxon’s test (p < 0.05). (c) Differential expression of electron transfer chain genes at ZT0 in the GPFA124 hybrid compared to Caturra. Incoming light is represented by the dotted red line. Electron transport pathways are shown by black dotted lines. Blue dotted lines indicate cyclic electron flux. Proton fluxes are indicated by continuous red lines. Linear electron flow (LEF) transport is initiated by the simultaneous absorption of light by two antenna complexes (LHCII and LHCI). The absorbed energy is then transferred to the reaction center chlorophylls P680 and P700. The excited state, P680*, donates an electron to pheophytin which, in turn, reduces the primary PQ electron acceptor, QA. QA reduces the secondary PQ electron acceptor, QB. On the donor side of PSII, the hole remaining in P680+ is filled by a redox-active tyrosine, YZ, which subsequently reduces OEC. Electrons are then transferred from PSII through the PQ pool to Cytb6f, which pumps two additional protons across the membrane for each oxidized plastoquinol. Electrons are transported from Cytb6f to PSI by the soluble electron carrier plastocyanin (PC). PSI acts as light-driven plastocyanin FD oxidoreductase. Ultimately, FNR reduces NADP+ to NADPH at the expense of reduced FD. Cyclic electron flow (CEF) proceeds through PSI and Cytb6f. Electron transport is coupled to proton translocation into the thylakoid lumen, and the resulting pH gradient drives ATP synthase to produce ATP. The reducing power generated via the so-called light reactions, NADPH, as well as the energy available from ATP hydrolysis, are critical for producing sugars from CO2 through the Calvin–Benson cycle. OEC, oxygen-evolving complex; YZ, redox-active tyrosine; PSII, photosystem II; Pheo, pheophytin; QA, primary electron acceptor quinone molecule; QB, secondary electron acceptor quinone molecule; PQ, plastoquinone; Cytb6f, cytochrome b6f; PC, plastocyanin; LHCI, light-harvesting complex I; PSI, photosystem I; FD, ferredoxin; FNR, ferredoxin–NADP+ reductase. The names of the different parameters contributing to PItot (FV/T0; RC/ABS; (1 − VJ)/VJ; δRE1o) are written above the process they measure. Levels of differential expression at ZT0 between the inbred Caturra line and GPFA124 hybrid are represented with colored dots. Red and blue colors represent significant up- and downregulation, respectively, in the GPFA124 hybrid compared to the inbred Caturra line (corrected Bonferroni p-value < 0.05). The genes represented are phototropin 2 (CaPHOT2; Cc02_g31790), phytochrome (CaPHY; Cc02_g36930), cryptochrome (CaCRY; Cc10_g07160; Cc03_g05480), light-harvesting complex II chlorophyll a/b binding protein 4 (CaLHCB4; Cc06_g01460), light-harvesting complex II chlorophyll a/b binding protein 5 (CaLHCB5; Cc10_g16210), photosystem II 10 kDa polypeptide (CaPsbR; Cc05_g15930), photosystem II protein D1 (CaPsbA, gene1), photosystem II protein D2 (CaPsbD, gene28), cytochrome f (CaPetA, gene57), cytochrome b6/f complex subunit IV (CaPetD, gene77), cytochrome b6 (CaPetB, gene76), photosystem I P700 apoprotein A1 (CaPsaA, gene36), photosystem I P700 apoprotein A2 (CaPsaB, gene35), photosystem I subunit IX (CaPsaJ, gene66), photosystem I assembly protein Ycf4 (CaYcf4, gene55) (Table S1).

