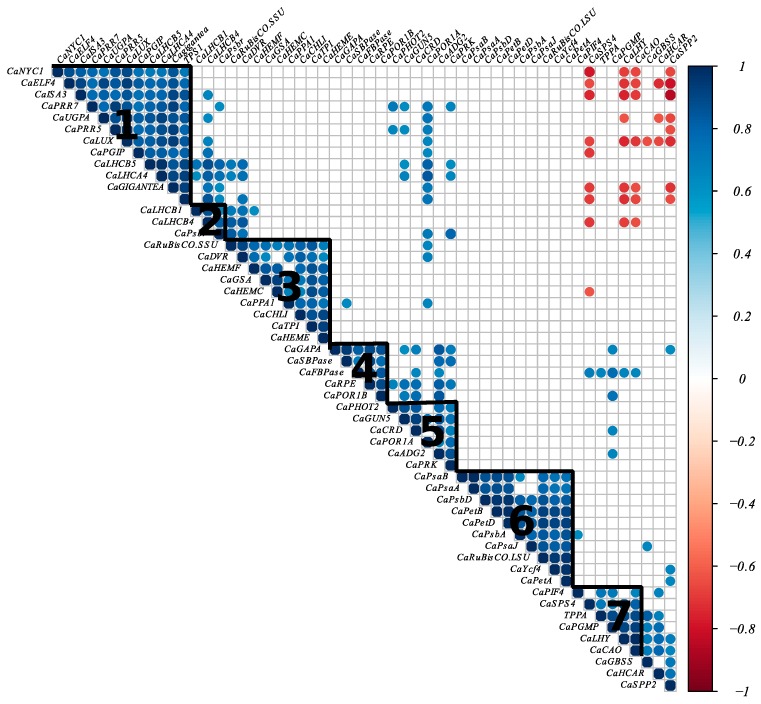
Figure 5.
Heat map of circadian clock, photosynthesis, and chlorophyll metabolism gene correlations. A heat map of correlations for 54 genes involved in the circadian clock, photosynthesis, and chlorophyll metabolism was created following hierarchical clustering based on the Pearson correlation coefficient. Colors denote Pearson correlation coefficient between genes. Significant positive and negative correlations are in blue and red, respectively (p < 0.001). We identified seven clusters, annotated from 1 to 7 in the heat map.

