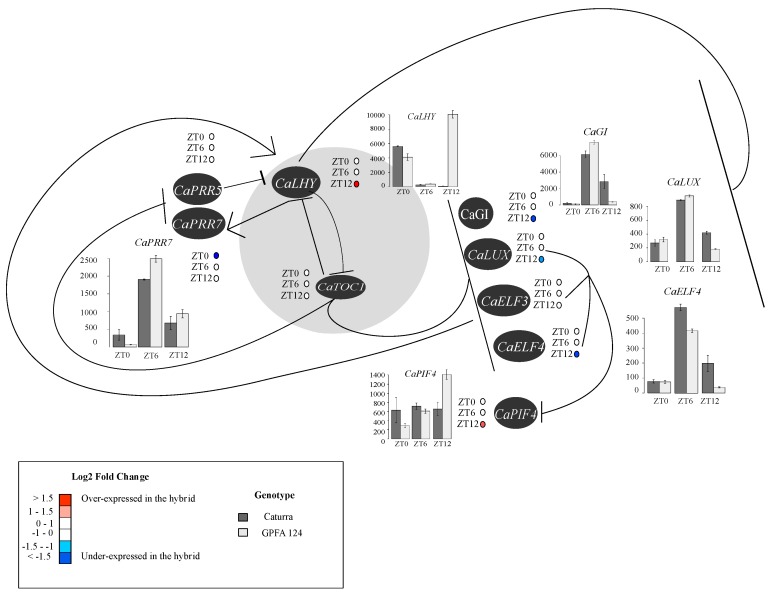
Figure 6.
Altered expression patterns of circadian clock genes in the F1 hybrid during the day. The core clock is represented in gray. Arrows represent activation and horizontal line repression. Levels of differential expression at ZT0, ZT6, and ZT12 between the inbred Caturra line and GPFA124 hybrid are represented with colored dots. Red and blue colors represent significant up- and downregulation, respectively, in the GPFA124 hybrid compared to the inbred Caturra line (corrected Bonferroni p-value < 0.05). When differences in gene expression between Caturra and GPFA124 are significant at ZT0, ZT6, or ZT12 (corrected Bonferroni p-value < 0.05), relative log expression (rle) normalized data are plotted at ZT0, ZT6, and ZT12. Caturra and GPFA124 are in dark and light gray, respectively.

