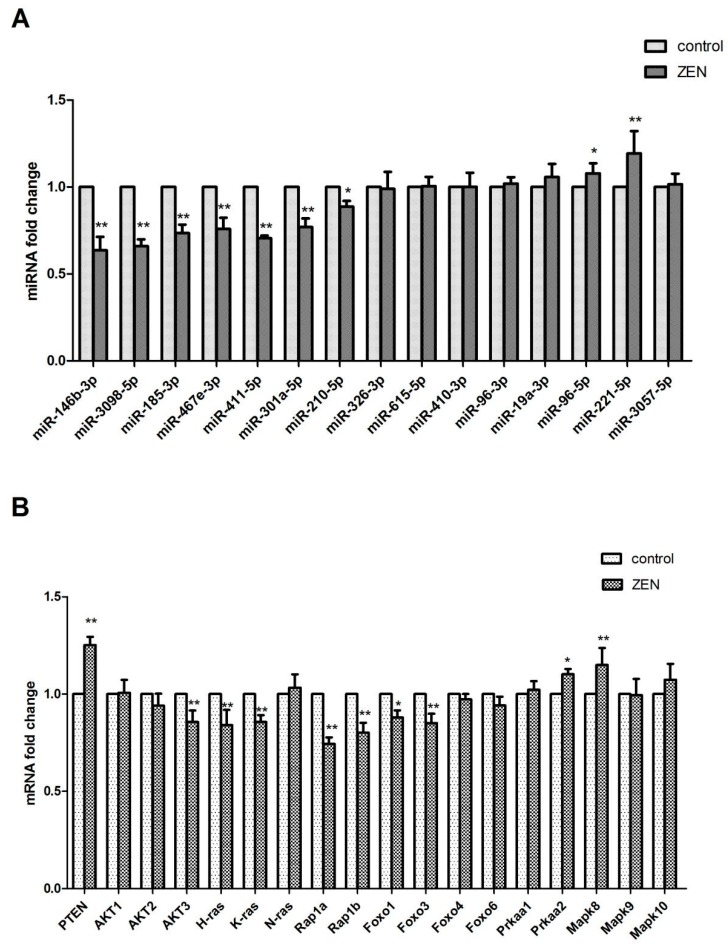
Figure 5.
(A) Validation of the differentially expressed miRNAs. (B) Verification of the miRNA target genes. The qRT-PCR analyses of the mRNA expression levels ofmiR-146b-3p, miR-3098-5p, miR-185-3p, miR-467e-3p, miR-411-5p, miR-301a-5p, miR-210-5p, miR-326-3p, miR-615-5p, miR-410-3p, miR-96-3p, miR-19a-3p, miR-96-5p, miR-221-5p, miR-3057-5p, PTEN, AKT1, AKT2, AKT3, H-ras, N-ras, K-ras, Rap1a, Rap1b, Foxo1, Foxo3, Foxo4, and Foxo6 in the control and ZEA-exposed TM3 Leydig cells. The gene expression levels represent the mRNA expression levels relative to the control levels (the values represent mean ± SD). The asterisks are used to indicate a statistically significant difference: * p < 0.05; ** p < 0.01.

