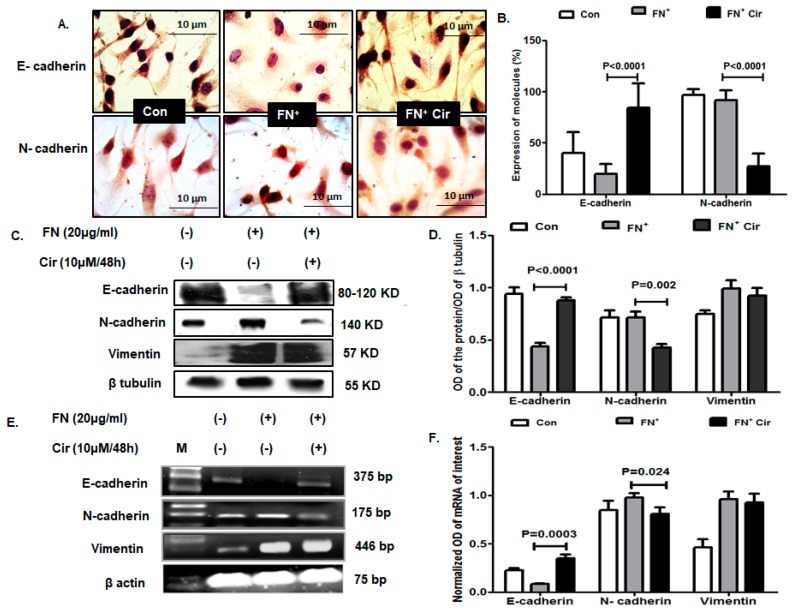
Figure 4.
Effect of cirsiliol on epithelial and mesenchymal markers in B16F10 cells. (A) Representative micrographs of immunocytochemistry (400× magnification) and (B) graph with percentage of cells expressing E-cadherin and N-cadherin revealed that FN+/Cir (10 µM/48 h) increased cytoplasmic expression of E-cadherin and decreased that of N-cadherin with respect to FN+-induced cells. (C) Images of western blot and (D) quantitative expression of mean band intensity exhibited that FN-induced downregulation of E-cadherin and upregulation of N-cadherin was significantly reversed with FN+/Cir (10 µM/48 h). Vimentin did not show any significant change of expression by FN+/Cir (10 µM/48 h) with respect to FN+-induced cells. (E) The transcript profile images and the (F) mean band intensities showed that FN+-induced downregulation of E-cadherin and upregulation of N-cadherin was significantly counteracted with FN+/Cir (10 µM/48 h). Vimentin did not show any significant change of mRNA expression by FN+/Cir (10 µM/48 h) in comparison to FN+-induced cells. Cir: cirsiliol; FN+: cells were seeded in pre-coated (cellular FN 20 μg/mL for 2 h at 37 °C) petri dishes and further incubated for 48 h in presence of 5% FBS for induction of EMT; FN+/Cir (10 µM/48 h): cells were seeded in pre-coated (cellular FN 20 μg/mL for 2 h at 37 °C) petri dishes and treated with subjected to a non-cytotoxic dose of cirsiliol (10 µM) treatment for 48 h; M: DNA step ladder 100 bp. All quantitative results are expressed as mean ± SD based on three replicates. Scanned blots of Figure 4 are showed in Figure S1.

