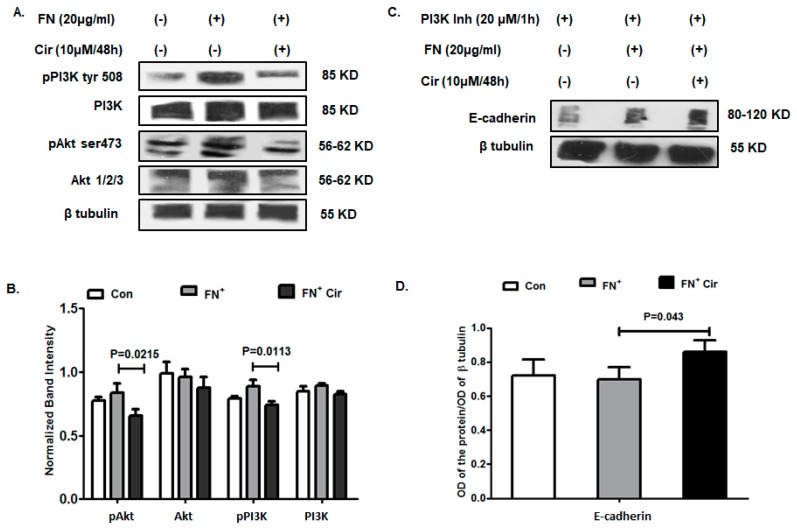
Figure 6.
Effect of cirsiliol on regulation of EMT in B16F10 cells. (A) Representative images of western blot and (B) graphical representation of the normalized band intensities implied reduced phosphorylation status of both PI3Ktyr508 and pAktser473 treatment with FN+/Cir (10 µM/48 h) treated cells than FN+-induced cells. (C) Western blot images and (D) graphical representation of mean band intensities of the upregulated expression of E-cadherin in the FN+-induced B16F10 cells and FN+/Cir (10 µM/48 h) treated B16F10 cells in comparison to control cells in presence of PI3K inhibitor. Cir: cirsiliol; FN+: cells were seeded in pre-coated (cellular FN 20 μg/mL for 2 h at 37 °C) petri dishes and further incubated for 48 h in the presence of 5% FBS for induction of EMT; FN+/Cir (10 µM/48 h): cells were seeded in pre-coated (cellular FN 20 μg/mL for 2 h at 37 °C) petri dishes and treated with subjected to a non-cytotoxic dose of cirsiliol (10 µM) treatment for 48 h. All quantitative results are expressed as mean ± SD based on three replicates. Scanned blots of Figure 6 are showed in Figure S3.

