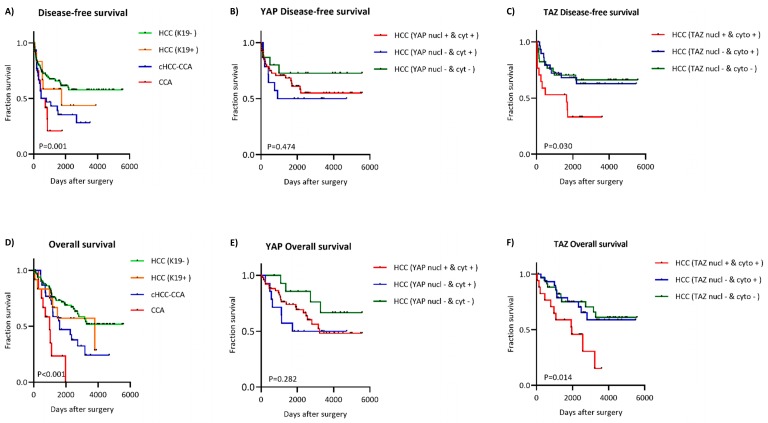
Figure 3.
Kaplan–Meier curves for disease-free survival and overall survival are illustrated for the subgroups HCC, cHCC-CCA, and CCA (A,D). Expression of YAP in the nucleus and/or cytoplasm in Kaplan–Meier curves for OS and DFS in HCC K19− (B,E). TAZ expression in the nucleus and/or cytoplasm in HCC K19− (C,F).

