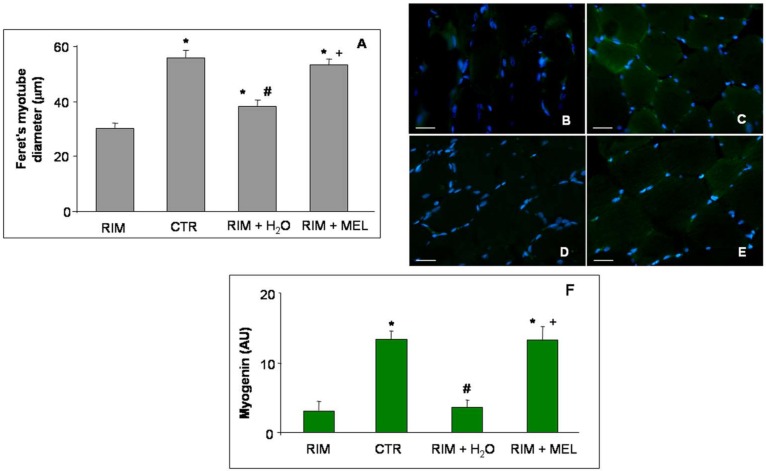
Figure 2.
Myotube diameter and myogenin expression. The graph (A) shows the analyses of Feret’s myotube diameter of gastrocnemius skeletal muscle, expressed in µm. The immunofluorescence photomicrographs (B–E) show the gastrocnemius skeletal muscle myogenin expression of RIM rats (B), control rats (C), RIM rats plus tap water (D), and RIM rats supplemented with melatonin (E). Bar equal: 20 µm. Graph (F) summarizes the immunomorphometrical measurement of myogenin immunopositivity. * p ≤ 0.05 vs. RIM; # p ≤ 0.05 vs. CTR; + p ≤ 0.05 vs. RIM + H2O. CTR: control; H2O: tap water; MEL: melatonin; RIM: reserpine-induced myalgia.

