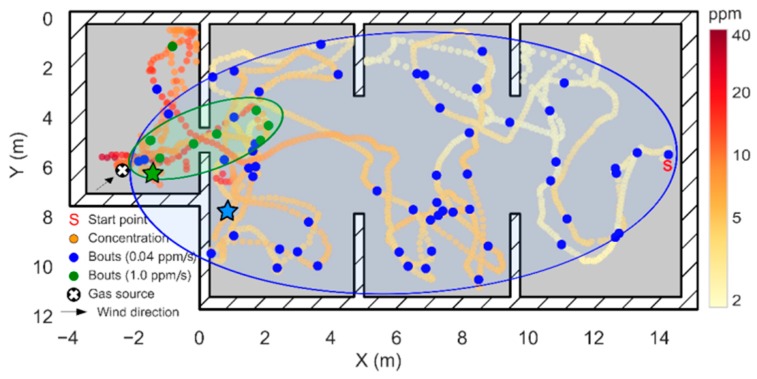
Figure 16.
Effect of the bout amplitude threshold in the results of Experiment 1. The blue circles represent bouts with amplitude higher than 0.04 ppm/s ( threshold) and the green circles represent bouts with amplitude higher than 1.0 ppm/s. In each case, a hand-drawn ellipse outlines the approximate plume shape based on the location of the bouts. The green and blue stars indicate the source location estimate in each case, according to the maximum bout frequency.

