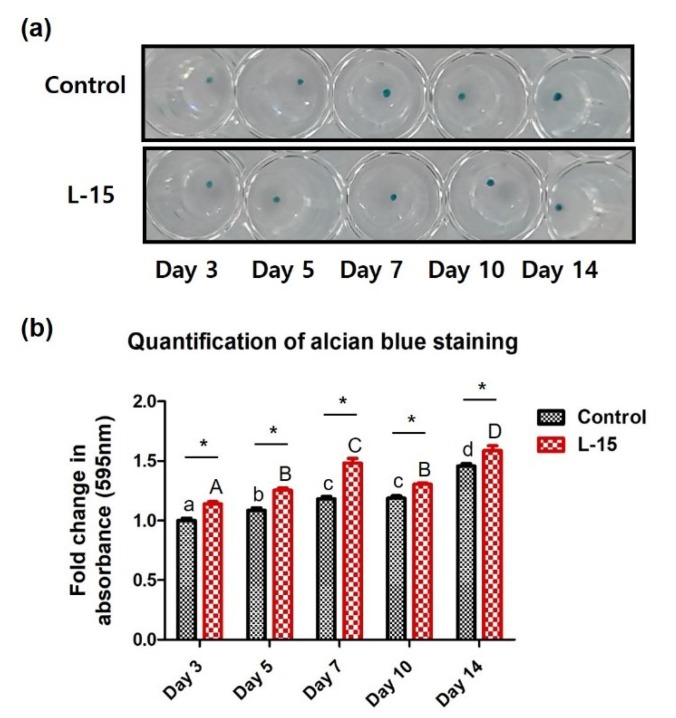
Figure 5.
(a) Alcian blue staining of the control and L-15 extract-treated groups. (b) Quantitative measurements of alcian blue staining (n = 3). Error bars represent mean ± S.D. A, B, C, and D values of different superscripts indicate significant difference between LET groups and a, b, c, and d values of different superscripts indicate significant difference between control groups (* p < 0.05); two-way ANOVA was used.

