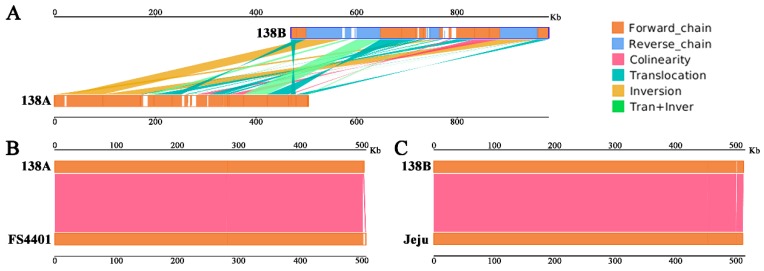
Figure 2.
Mitochondrial genome syntenic sequence analysis. (A) Syntenic sequence analysis of 138A and 138B; (B) syntenic sequence analysis of 138A and FS4401; (C) syntenic sequence analysis of 138B and Jeju. The upper and lower bars in each figure represented the mitochondrial genomes. Dark-orange and blue regions in each bar represented the forward and reverse direction of the aligned genome, respectively. White regions in each bar represent the sequences that could not be aligned to the other genome. Lines between the two bars indicated the syntenic types and locations: magenta, blue-green, dark yellow, and light-green represent for collinear, translocation, inversion, and tran + inver, respectively.

