Figure 2.
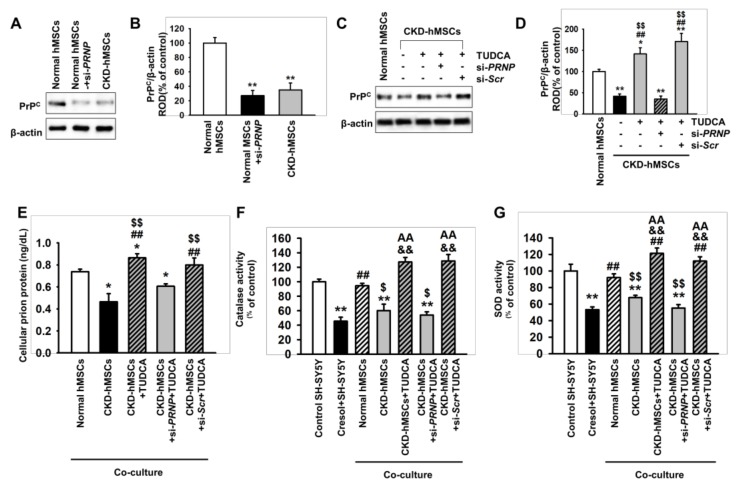
Co-culture of SH-SY5Y cells with TUDCA-stimulated Chronic kidney disease (CKD-hMSCs) increases the activity of anti-oxidant enzymes via upregulation of PrPC. (A) Western blot showing the expression of cellular prion protein (PrPC) in normal human MSCs (hMSCs), normal hMSCs pretreated with PRNP (PRioN Protein) siRNA (si-PRNP) for 48 h, and hMSCs isolated from a CKD patient (CKD-hMSCs) (n = 3). (B) The level of PrPC in (A) was determined by densitometry relative to β-actin. (C) Western blot showing the expression of PrPC in CKD-hMSCs pretreated with TUDCA (1 μM) for 24 h. CKD-hMSCs were pretreated with PRNP siRNA (si-PRNP) or Scramble siRNA (si-SCR) for 48 h, then treated with TUDCA (n = 3). (D) The expression of PrPC was determined by densitometry relative to β-actin. (E) The concentration of PrPC in SH-SY5Y cells after co-culture with hMSCs (n = 5). (F and G) Catalase (F) and SOD activity (G) in SH-SY5Y cells following co-culture with hMSCs. Statistical analysis: Values represent the mean ± SEM. (B) ** p < 0.01 vs. normal hMSCs. (D) ** p < 0.01 vs. normal hMSCs, ## p < 0.01 vs. CKD-hMSCs, $$ p < 0.01 vs. TUDCA-treated CKD-hMSCs pretreated with si-PRNP. (F) *p < 0.05 vs. normal MSCs, ## p < 0.01 vs. CKD-hMSCs, $$ p < 0.01 vs. CKD-hMSCs + si-PRNP + TUDCA. (F and G) ** p < 0.01 vs. control SH-SY5Y cells without co-culture, ## p < 0.01 vs. P-cresol+SH-SY5Y without co-culture, $ p < 0.05, $$ p < 0.01 vs. co-culture with normal hMSCs, && p < 0.01 vs. co-culture with CKD-hMSCs, AA p < 0.01 vs. co-culture with CKD-hMSCs + si-PRNP + TUDCA.

