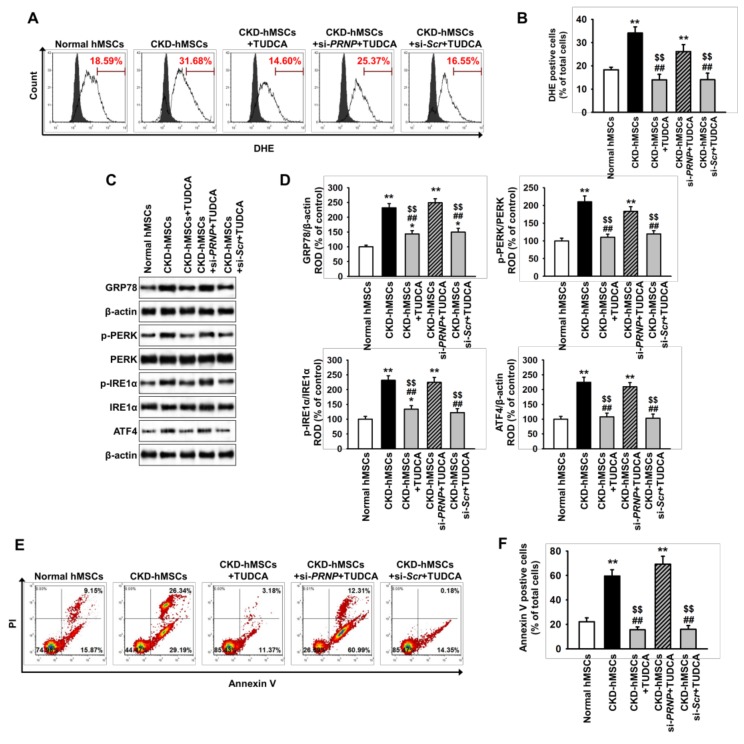
Figure 3.
Co-culture with TUDCA-treated CKD-hMSCs prevents apoptosis of SH-SY5Y cells in the presence of uremic toxin through protection of ER stress. In the presence of P-cresol, SH-SY5Y cells were co-cultured with hMSCs and subsequently analyzed by flow cytometry analysis and western blot. (A) Flow cytometry analysis for DHE staining in SH-SY5Y cells after co-culture with hMSCs (n = 5). The filled and clear histograms represent cells in the absence and presence of DHE, respectively. (B) Quantification of the percentage of DHE positive cells from (A). (C) Western blot analysis for GRP78, p-PERK, PERK, p-IRE1α, IRE1α, and ATF4 in SH-SY5Y cells after co-culture with hMSCs (n = 3). (D) The protein levels of (C) were determined by densitometry relative to β-actin. (E) Flow cytometry analysis following PI/Annexin V staining of SH-SY5Y cells co-cultured with hMSCs (n = 5). (F) Quantification of the percentage of Annexin V positive cells from (E). Statistical analysis: Values represent the mean ± SEM. (B) ** p < 0.01 vs. co-culture with normal hMSCs, ## p < 0.01 vs. co-culture with CKD-hMSCs, $$ p < 0.01 vs. co-culture with CKD-hMSCs + si-PRNP + TUDCA. (D) * p < 0.05, ** p < 0.01 vs. co-culture with normal hMSCs, ## p < 0.01 vs. co-culture with CKD-hMSCs, $$ p < 0.01 vs. co-culture with CKD-hMSCs + si-PRNP + TUDCA. (F) ** p < 0.01 vs. co-culture with normal hMSCs, ## p < 0.01 vs. co-culture with CKD-hMSCs, $$ p < 0.01 vs. co-culture with CKD-hMSCs + si-PRNP + TUDCA.

