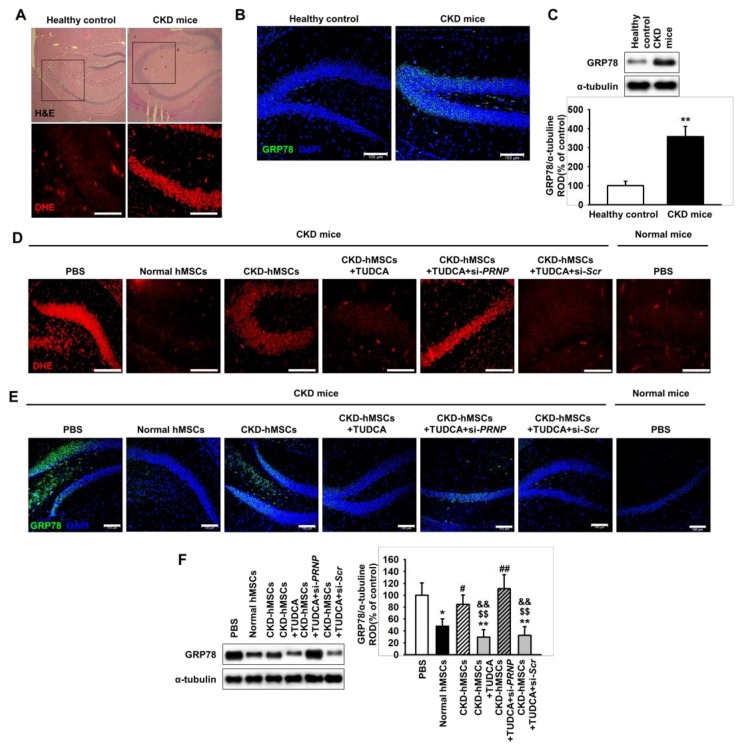
Figure 4.
Co-culture of SH-SY5Y cells with TUDCA-stimulated CKD-hMSCs increases the activity of anti-oxidant enzymes via upregulation of PrPC. (A) In healthy mice (n = 3) or murine CKD model (n = 3), hematoxylin and eosin (H and E; upper images) staining and dihydroethidium (DHE, red; cropped images) staining were performed on hippocampus sections. (B) Immunofluorescence staining for glucose-regulated protein 78 (GRP78) in the hippocampus of a CKD mouse (n = 3). Scale bars = 100 μm. (C) Western blot analysis for GRP78 in the hippocampus of a healthy mouse and a CKD mouse (n = 3). The protein levels were determined by densitometry relative to α-tubulin. (D) DHE staining (red) the hippocampus of a murine CKD model was injected with either phosphate buffer saline (PBS) or each type of hMSCs. For each mouse (n = 3), the hippocampus was isolated and analyzed 25 days after the first injection. (E) Immunofluorescence staining for GRP78 in the hippocampus of a murine CKD model was injected with either PBS or each type of hMSCs (n = 3). Scale bar =100 μm. (F) Western blot analysis for GRP78 in the hippocampus of a murine CKD model (n = 3). The protein levels were determined by densitometry relative to α-tubulin. Statistical analysis: Values represent the mean ± SEM. (C) ** p < 0.01 vs. healthy control. (F) * p < 0.05, ** p < 0.01 vs. PBS, # p < 0.05, ## p < 0.01 vs. normal hMSCs, $$ p < 0.01 vs. CKD-hMSCs, && p < 0.01 vs. CKD-hMSCs + TUDCA + si-PRNP.

