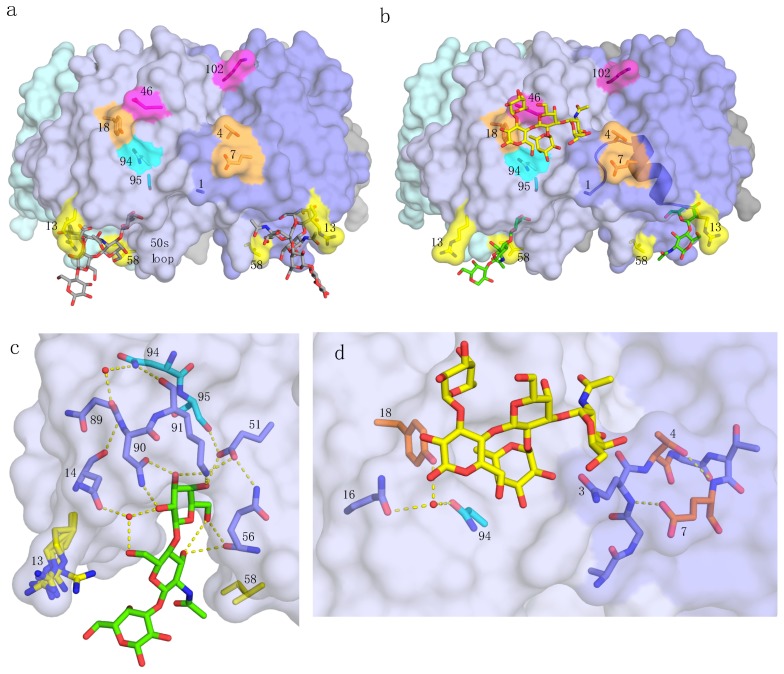
Figure 1.
pLTB structure and interactions. Residues and features of special importance for this work are marked, with residues colored in groups, as discussed in Section 2. (a) pLTB (PDB ID: 2XRQ [10]) shown in surface representation, colored by subunit. The GM1 oligosaccharide is shown in stick representation, with grey carbons. (b) pLTB in complex with lacto-N-neotetraose (LNnT; PDB ID: 2XRS [10]), in a collage with an analogue of the blood group A-pentasaccharide bound to the secondary binding site, superimposed from hLTB structure 2O2L [19]. Not all of the carbohydrate residues were modeled for LNnT, due to weak electron density at the non-reducing end. The α-helix connecting residues 1 through 14 is shown in cartoon representation. (c) Close-up view of the primary binding site of pLTB with LNnT (PDB ID: 2XRS [10]). Important residues are shown in stick representation, and the hydrogen-bonding network in yellow dotted lines, extending up to residue 94 (cyan). Two conserved water molecules are depicted as red spheres. Residue 13 (yellow) adopts alternative conformations in the different subunits, and residue 58 (yellow) has van der Waals contacts to the methyl group of GlcNAc. (d) Close-up view of relevant residues at the secondary binding site of pLTB (PDB ID: 2XRS [10]), with the A-pentasaccharide (from PDB ID: 2O2L [19]) superimposed in yellow sticks. Important residues on both sides of the secondary binding site are shown.

