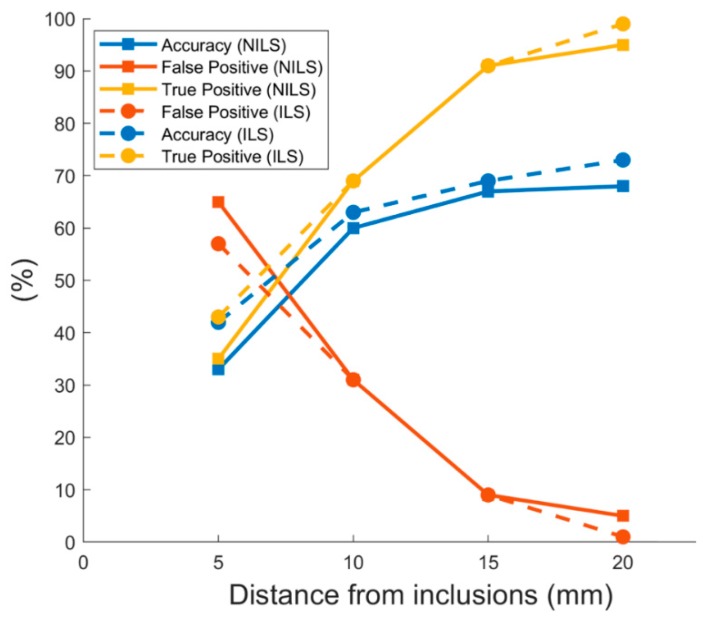
Figure 6.
Tolerance of recognized inclusions: each point (dots for ILS and squares for NILS) represents the mean accuracy (blue line), mean false positive (red line), and mean true positive (yellow line) responses evaluated through a classification based on the admitted center-to-center distance between perceived inclusions and the real ones.

