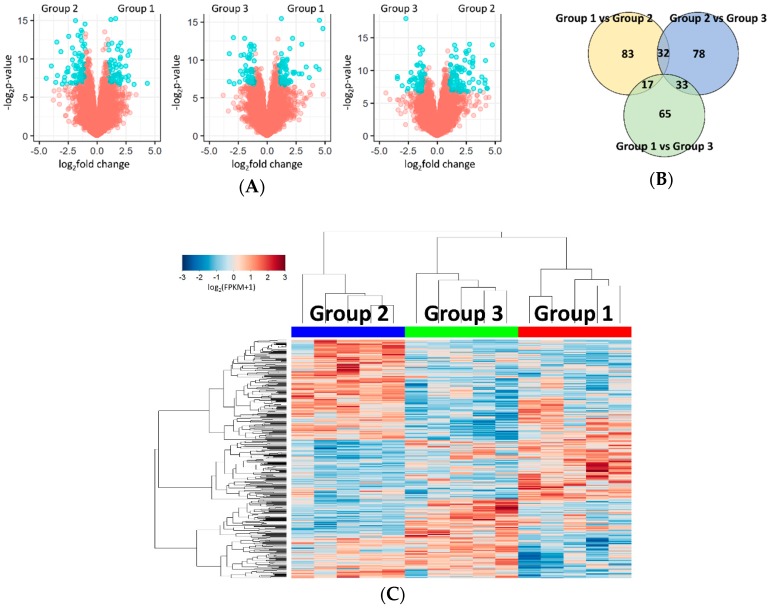
Figure 2.
Identification of differentially expressed genes (DEGs) between the subgroups of non-muscle-invasive papillary high-grade UTUC. (A) Volcano plots of the DEGs between each subgroup. Genes that meet the threshold are in blue. (B) Venn diagram of all comparisons demonstrates 308 DEGs across the subgroups. (C) Unsupervised hierarchical clustering of all DEGs for all samples.

