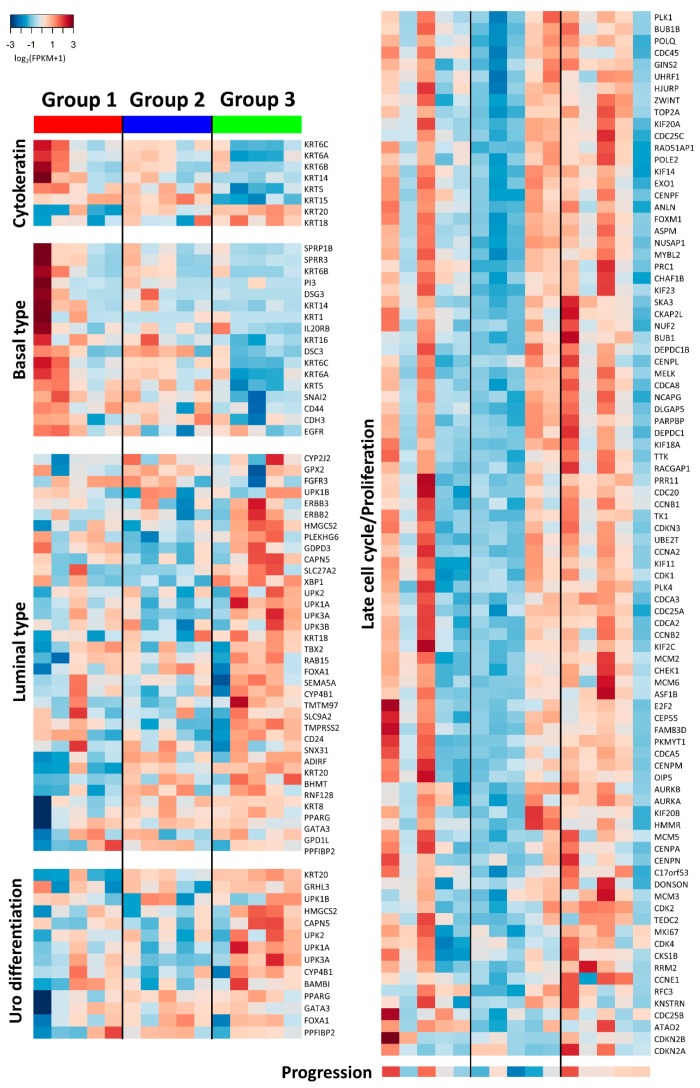
Figure 7.
Heatmaps of known biological signature genes extracted from previous reports, with samples arranged in each column and subgroups divided by black vertical lines. Progression (right bottom) was visualized according to the integrated score (red, high; blue, low). Uro differentiation, urothelial differentiation.

