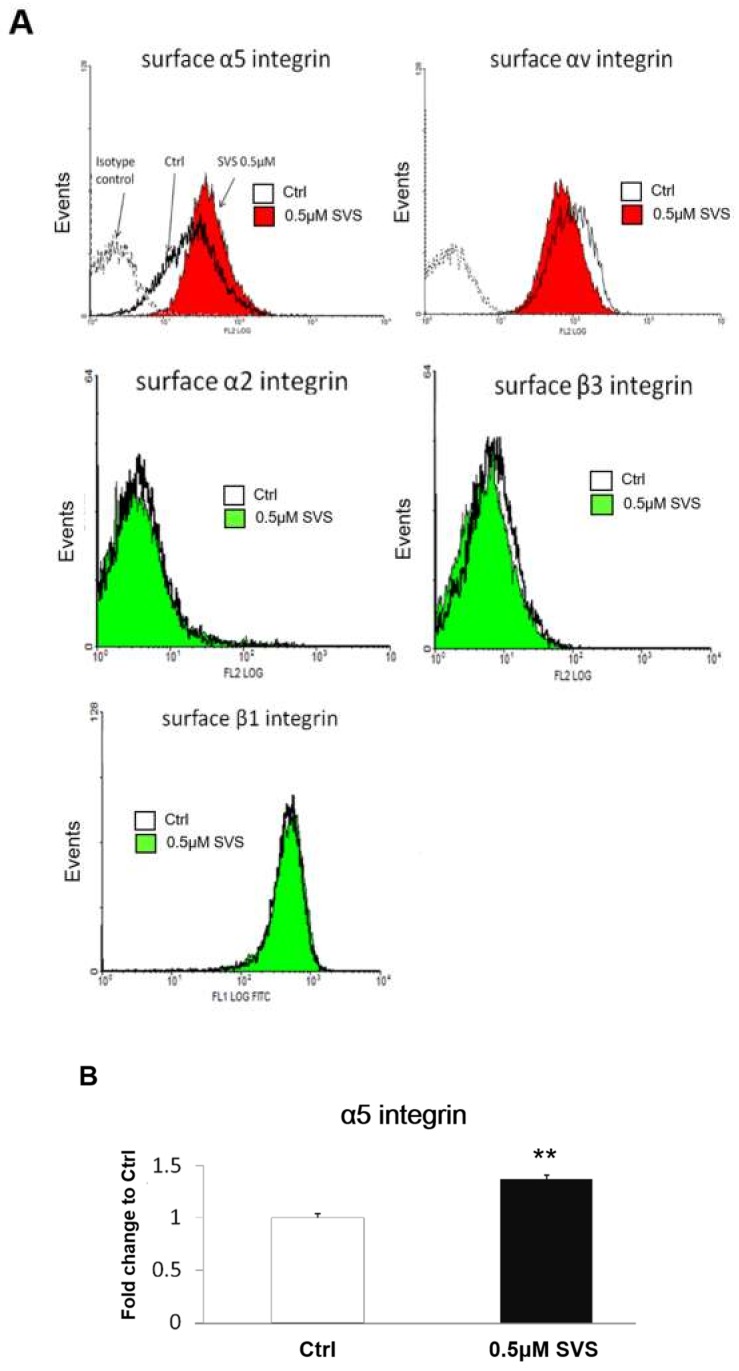
Figure 3.
SVS increases the expression of α5 integrin on the surface of D1 cells. D1 cells (passage 8) were treated with SVS in basal medium at concentrations of 0 (control: Ctrl) or 0.5 µM for 3 days. (A) Cells were trypsinized and subjected to flow cytometry analysis for detecting α5, αV, α2, β1, and β3 cell surface integrins. The cells were stained with either phycoerythrin (PE)- or fluorescein isothiocyanate (FITC)-conjugated antibodies and analyzed via flow cytometry. FITC-conjugated IgG1 and PE-conjugated IgG1 of the same isotypes were used as isotype controls. (B) Quantification of the mean fluorescence of stained surface α5 integrin in D1 cells treated with SVS in basal medium at concentrations of 0 (control: Ctrl) or 0.5 µM SVS for 3 days. The expression level of surface α5 integrin is expressed relative to the Ctrl, which is defined as 1. Data are presented as the mean ± SD (n = 3). ** p < 0.01 in comparison to the Ctrl.

