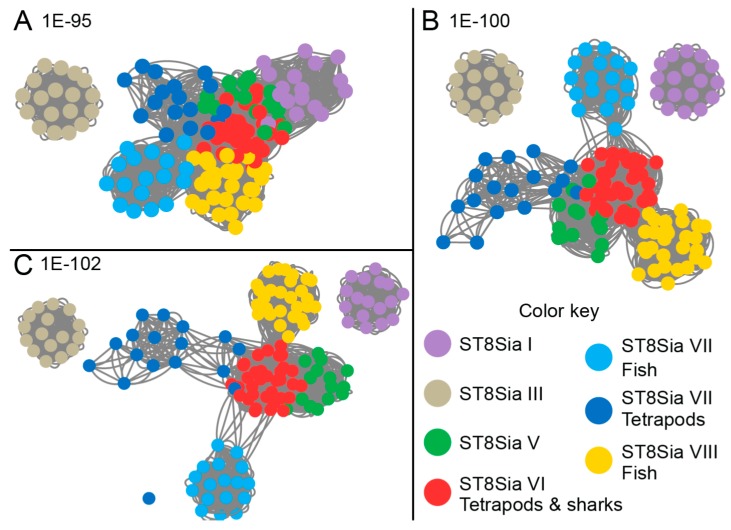
Figure 6.
ST8Sia sequence similarity network. The sequence similarity network including 147 vertebrate ST8Sia sequences was constructed as described in material and methods section. The sequences are represented as nodes colored according to the subfamily to which they belong. The lines between two nodes are drawn if the BLAST E-value is below the threshold indicated in the figure. Three E-value thresholds are used to visualize the interconnectivity evolution, ordered.

