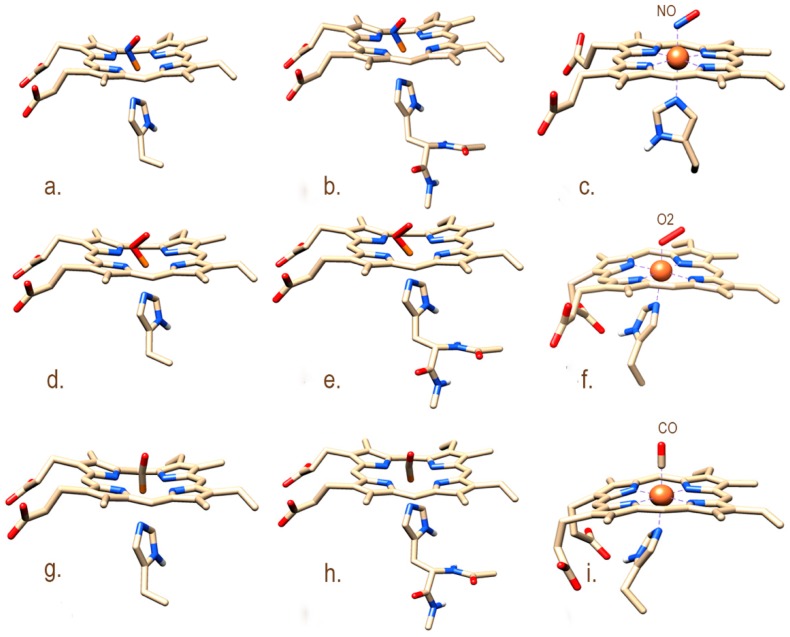
Figure 2.
HNOX active site models used in the parametrization procedure. (a,b), (d,e), and (g,h) represent the small and large model systems of active sites His-heme-NO, His-heme-O2 and His-heme-CO, respectively. Panels (c,f,i) show the optimized active site of the smaller models (a,d,g) that was further used for the parameterization of His-heme-NO/O2/CO.

