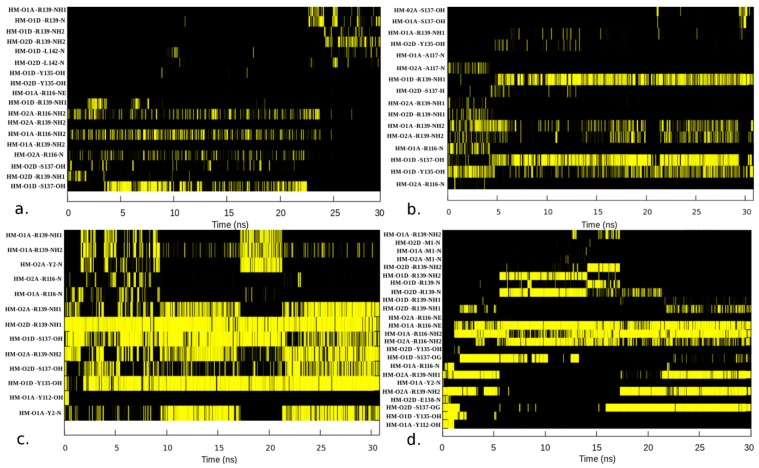
Figure 6.
Binding modes of (a) 5c NO-HNOX, (b) 6c NO-HNOX, (c) O2-HNOX and (d) CO-HNOX complexes with heme carboxyl groups. The x-axis represents the time (ns) while the y-axis shows the heme (HM) propionic moiety (O1A, O2A, O1D, O2D) and critical binding pocket residues atoms interacting by hydrogen bonds. Yellow color illustrates the presence of hydrogen bond while black color represents absence.

