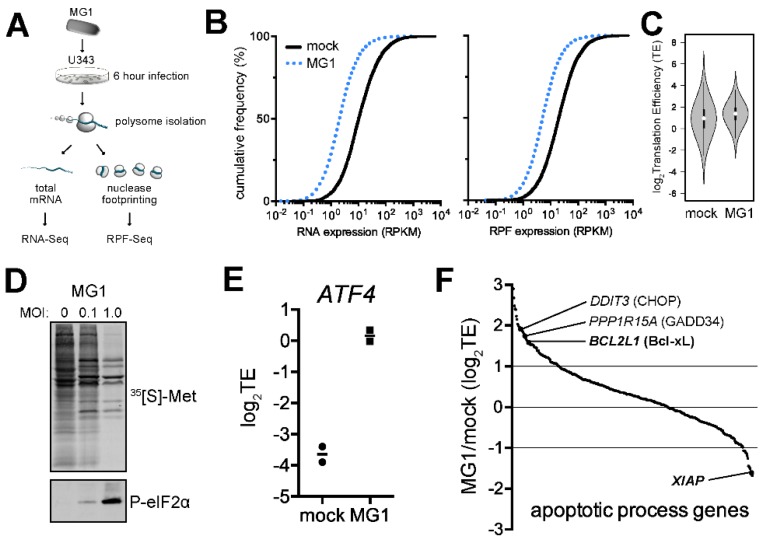
Figure 1.
Ribosome profiling of MG1-infected U343 cells highlights cellular targets of eIF2α phosphorylation and apoptosis. (A) Schematic of the ribosome profiling strategy used. Polysomes were fixed using cycloheximide prior to extraction. RPF; Ribosome protected fragments. (B) Cumulative frequency distributions of gene expression at the transcriptome (RNA) and translatome (RPF) levels in mock and MG1-infected cells. (C) Violin plots showing distribution of the translation efficiency (TE = RPF/RNA) for sequenced genes between mock and MG1-infected U343 cells. The median (central dot), interquartile range (black box), 95% confidence interval (vertical line) are shown, while the grey area represents a density plot wherein the width is proportional to the frequency of the TE values. (D) Radiograph (top) showing nascent peptide synthesis in mock-infected U343 cells (0 MOI) or increasing MOI of MG1 virus. Western blot (bottom) probing for phospho-eIF2α. (E) TE of ATF4, a known translational target of phospho-eIF2α, in mock- vs. MG1-infected U343 cells. (F) Distribution of TE for genes classified as “apoptotic processes” by the Gene Ontology consortium. Two known translation substrates of phospho-eIF2α, CHOP and GADD34 demonstrated enhanced TE, while other apoptotic regulators such as Bcl-xL and XIAP exhibited antipodal TEs. **** p < 0.0001; determined using a non-parametric Kolmogorov-Smirnov statistical test.

