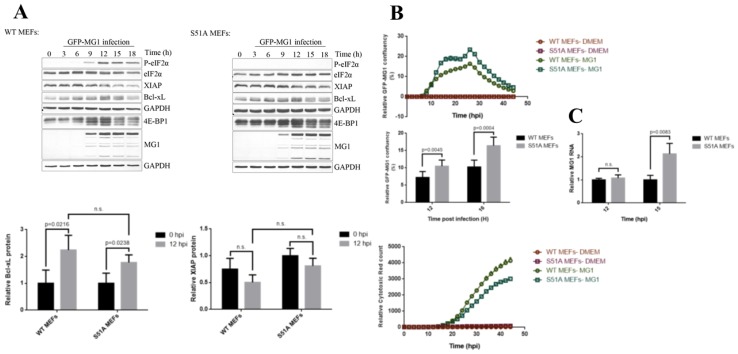
Figure 4.
The levels of MG1 proteins and up-regulation of Bcl-xL protein are independent of eIF2α phosphorylation. (A) Western blot analysis from the time course infection of WT and S51A MEFs with MG1 at MOI = 0.1 demonstrates the levels of Bcl-xL, XIAP proteins and de-phosphorylation of 4E-BP1. GAPDH is shown as the loading control. Relative Bcl-xL and XIAP expression levels to GAPDH at 12 hpi were normalized to uninfected cells (Bottom). (B) Top: IncuCyte live cell imaging demonstrates the confluency of GFP signal in WT and S51A MEFs in real time. Y axis depicts the percentage of GFP-MG1 infected cells relative to total cell confluency. Middle: Fold GFP-MG1 confluency between the two cell lines was quantified at 12 and 16 hpi. Bottom: Cytotox Red reagent was used in cells mock-infected or infected with MG1 virus and the activity of the fluorescent red dye was monitored over a time course. Y axis represents the number of cells emitting fluorescent red (dead cells) relative to the cell confluency. (C) MG1 genomic RNA was measured relative to the geometric mean of RPL13A and PPIA mRNAs in WT and S51A MEFs at 12 and 15 hpi.

