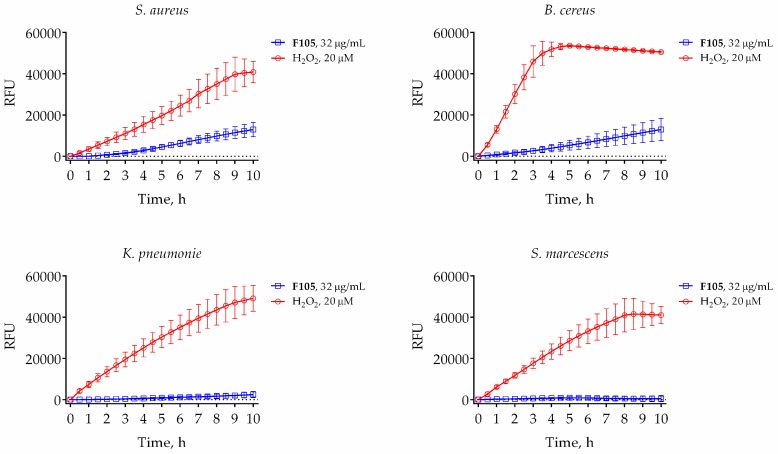
Figure 5.
Dynamics of reactive oxygen species (ROS) production in bacteria induced by 20 μM of hydrogen peroxide (red line) or 32 μg/mL of F105 (blue line). Black line stands for untreated control cells. Bacterial cells were grown for 18 h, harvested, and washed with PBS. Cells were re-suspended until the final density of 105 CFU/mL in PBS supplemented with 2′,7′-dichlorofluorescin diacetate (DCFDA) (5 μM). After 30 min of pre-incubation at 25 °C, 32 μg/mL F105 or 20 μM H2O2 were added and the fluorescence was measured for 9 h with 5-min time intervals.

