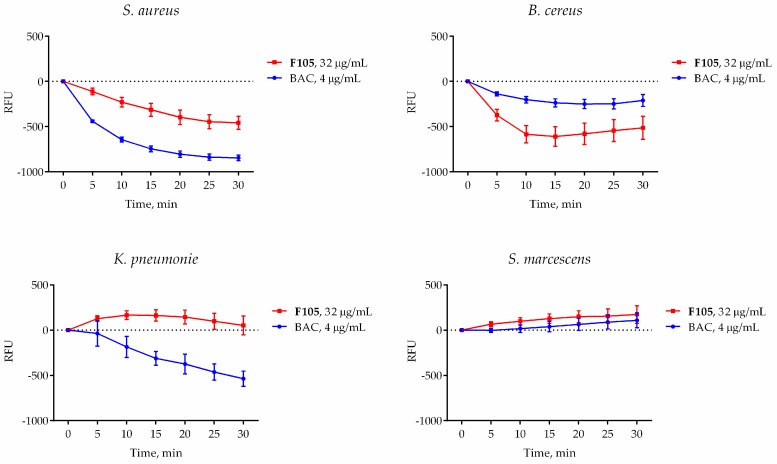
Figure 6.
The effect of F105 (blue line) and benzalkonium chloride (red line) on the membrane potential of bacterial cells. Bacteria were grown for 18 h, harvested, and washed with PBS. Cells were re-suspended until the final density of 105 CFU/mL in PBS supplemented with DioC2 (10 μM). After 30 min preincubation at 25 °C, F105 or BAC were added until final concentrations of 4 or 32 μg/mL, respectively (corresponding to their respective MBCs), and the fluorescence was measured for 30 min with 5-min intervals. Black dashed line indicates the same data for the untreated control cells.

