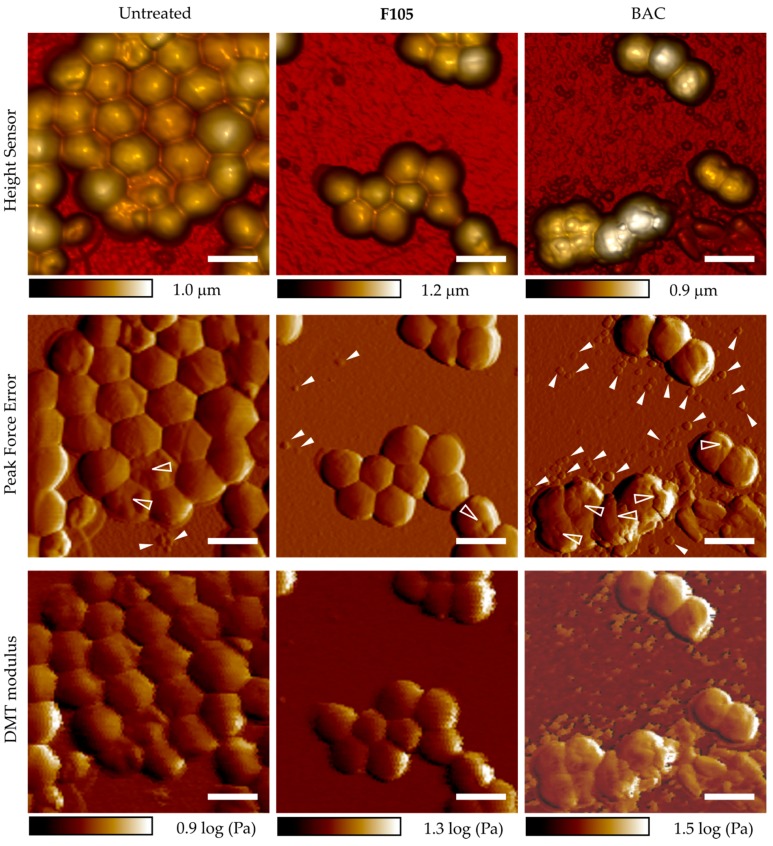
Figure 7.
Atomic force microscopy (peak force tapping mode) images of S. aureus planktonic cells after 18 h incubation with 4 μg/mL of BAC or 32 μg/mL of F105 (in correspondence with their respective MBCs). Scale bar is 2 µm. Cell wall damage is shown with transparent arrows; cell debris particles and organic substances are shown with white arrows).

