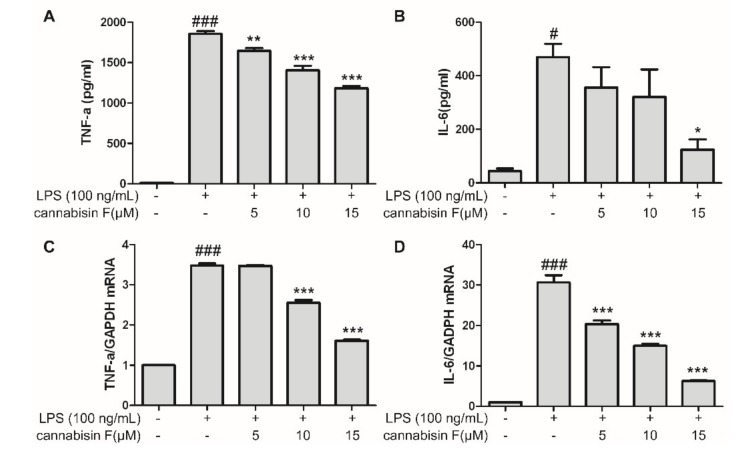
Figure 3.
Cannabisin F inhibited IL-6 and TNF-α production (A,B) and their mRNA expression (C,D) in LPS-stimulated BV2 microglia cells. BV2 microglia cells were pretreated with cannabisin F (5, 10 and 15 µM) for 1 h and then stimulated with LPS at 100 ng/mL for 24 h. The supernatants were harvested and the secretion of TNF-α (A) and IL-6 (B) were measured by ELISA. For qRT-PCR analysis, the mRNA levels of TNF-α (C) and IL-6 (D)were determined after incubation with LPS at 100 ng/mL for 6 h. The data are presented as mean ± SD from at least three independent experiments. *p < 0.05, **p < 0.01, ***p < 0.001 as compared to the cells treated with LPS; #p < 0.05, ###p < 0.001 as compared to the control.

