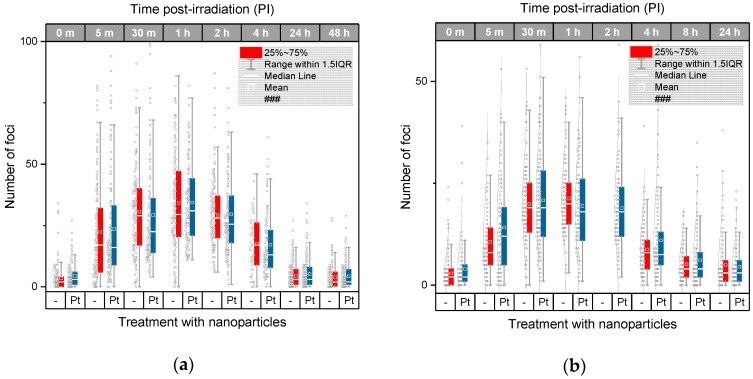
Figure 4.
Software analysis of the extent of γH2AX+53BP1 focus (DSB) induction and repair kinetics in U87 glioblastoma cells irradiated with 4 Gy (a) or 2 Gy (b) of γ-rays compared with cells treated (0.5 mM for 6 h) or not treated prior to irradiation with 2.6 nm platinum nanoparticles (Pt-NPs). The average and median numbers of co-localized γH2AX + 53BP1 repair foci (i.e., DSBs) per nucleus are shown for different periods of time PI, together with the focus number distributions in each cell population. The boxes include 50% of the values (25th to 75th percentile) centered on the median (the horizontal line through the box). The mean values are represented by the squares within the boxes. The outliers were identified according to the 1.5*IQR method (IQR = interquartile range). Pt—samples treated with platinum nanoparticles, m—the period of time after irradiation in minutes, 0 m—non-irradiated samples.

