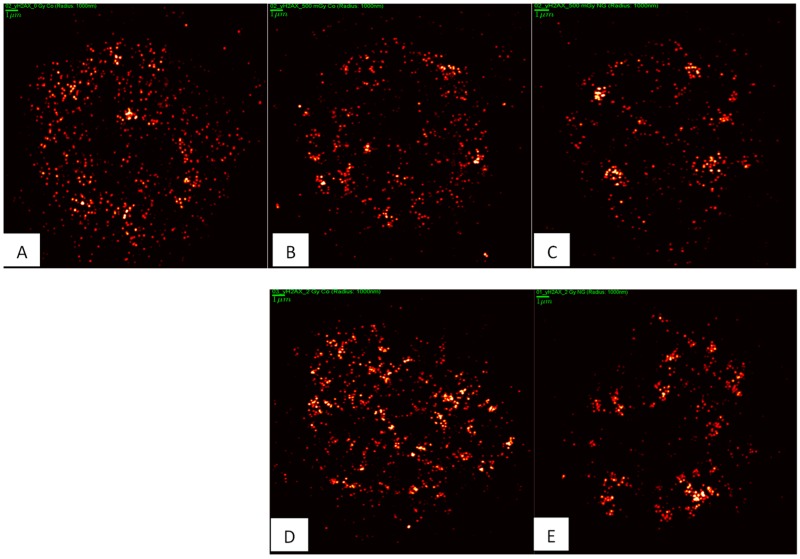
Figure 7.
Illustrative SMLM next-neighbor density images comparing γH2AX labelling tag numbers and distributions in SkBr3 cells after irradiation (B,D) without particle incubation and after irradiation preceded by uptake of 10 nm Au-NPs into the cytosol (C,E). The intensity of the points represents the number of next neighbors in a 1000 nm radius environment. The control without any treatment (no NP-incubation, and no irradiation) is shown in (A), indicating some repair activity also in untreated cells. Images of irradiated cell were taken at 45 min PI. Scale bar: 1 µm.

