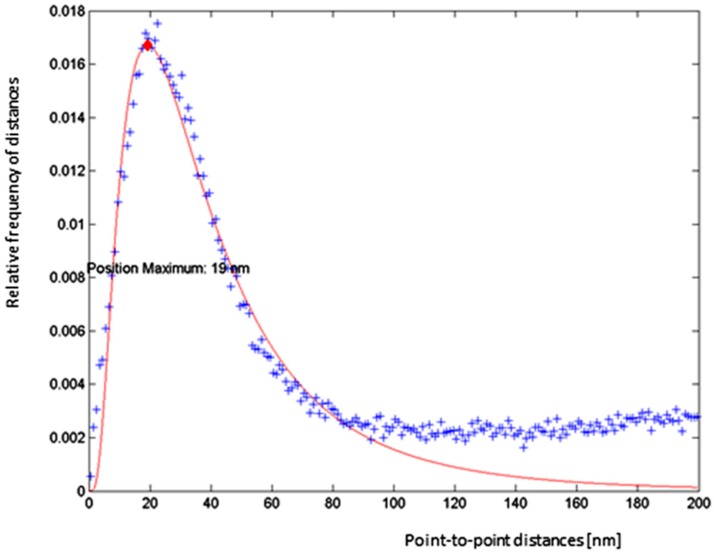
Figure 8.
Example of a distance frequency distribution obtained for γH2AX labelling tags in an SkBr3 cell nucleus of the control (no NPs) specimen exposed to 0.5 Gy of X-rays. In all cases independent of the treatment, compatible distributions were obtained, indicating a characteristic non-random distance distribution. (blue crosses: number of measured distances; red diamond: peak maximum; red curve: fit curve)

