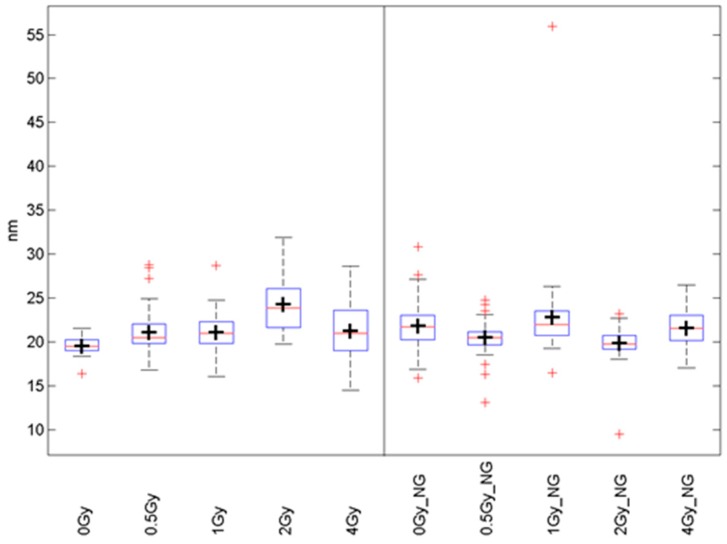
Figure 9.
Boxplots of distance frequencies between γH2AX labelling tags in SkBr3 cell nuclei of irradiated specimens (left) and Au-NP-incorporated and irradiated specimens (NG, right). (black cross: mean value; red line: median value; red cross: outliner; blue box: first quartile; dashed line: standard deviation)

