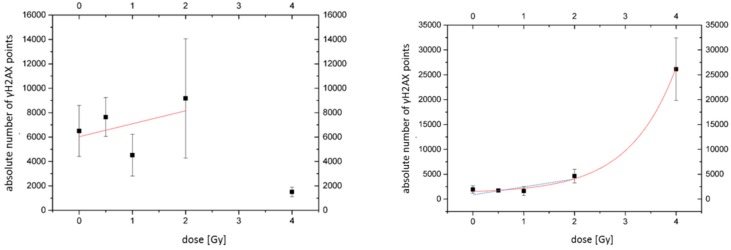
Figure 10.
Dose–efficiency curves (number of γH2AX labelling tags vs. dose counted by SMLM). For the irradiated SkBr3 cell nuclei without Au-NP incorporation (left graph, a linear increase (red fit curve) can be observed at doses between 0 and 2 Gy. This was compatible to the blue linear fitting curve for irradiated SkBr3 cell nuclei with Au-NP incorporation (right graph. For the higher dose values, an exponential growth (red fit curve) or quadratic increase could be fitted to the values. (black square: mean value; error bar: standard deviation)

