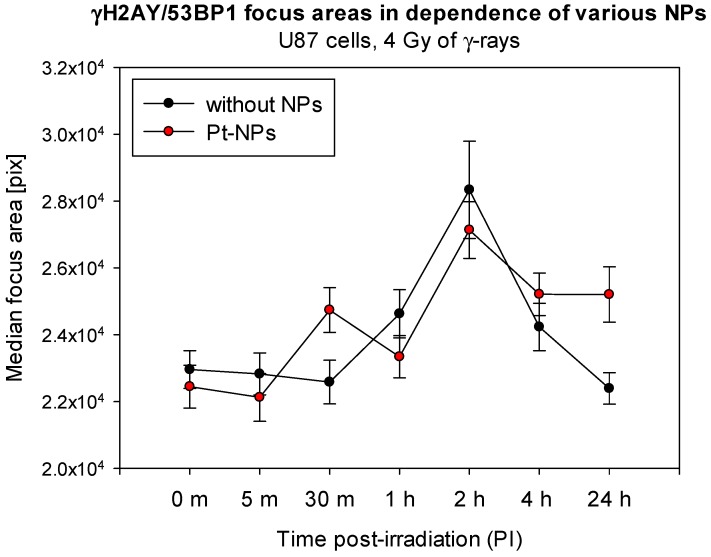
Figure 12.
Comparison of γH2AX/53BP1 focus areas at different periods of time PI compared for U87 cells irradiated with 4 Gy of γ-rays in absence or presence of Pt-NPs. The results of an automated software analysis are shown as mean numbers of pixels per focus. Black circles—without NPs, and red circles—Pt-NPs (0.5 mM, 6 h-incubation; preliminary results). Error bars = standard error, m = minutes, pix = pixels, 0 m = non-irradiated samples.

