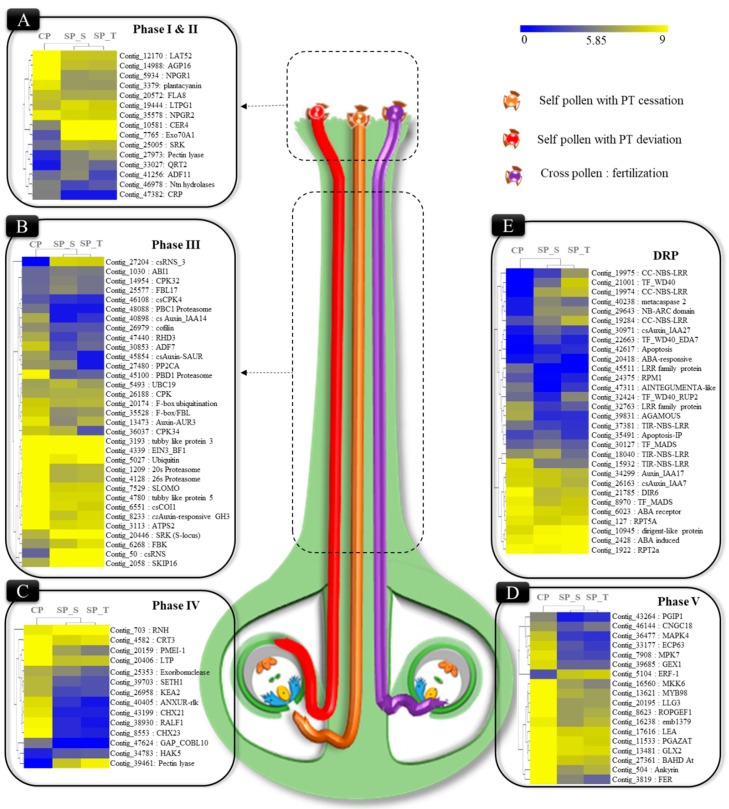
Figure 2.
Schematic representation of PT elongation inside self and cross-pollinated pistil [Self PT: deviated (red) and ceased (brown), cross PT fertilization (purple)] as observed in microscopy, along with expression pattern of transcripts involved in different phases of pollen-pistil interaction. The heatmap represents expression pattern (log2 transformed FPKM) in yellow-blue scale. (A) Transcripts expression of genes involved in pollen germination and PT elongation (Phase I & II); (B) PT elongation in mid-stylar region and incompatible interactions (Phase III); (C) PT ovular guidance/rejection (Phase IV); (D) fertilization in cross-pollinated (Phase V) and; (E) disease resistance proteins.

