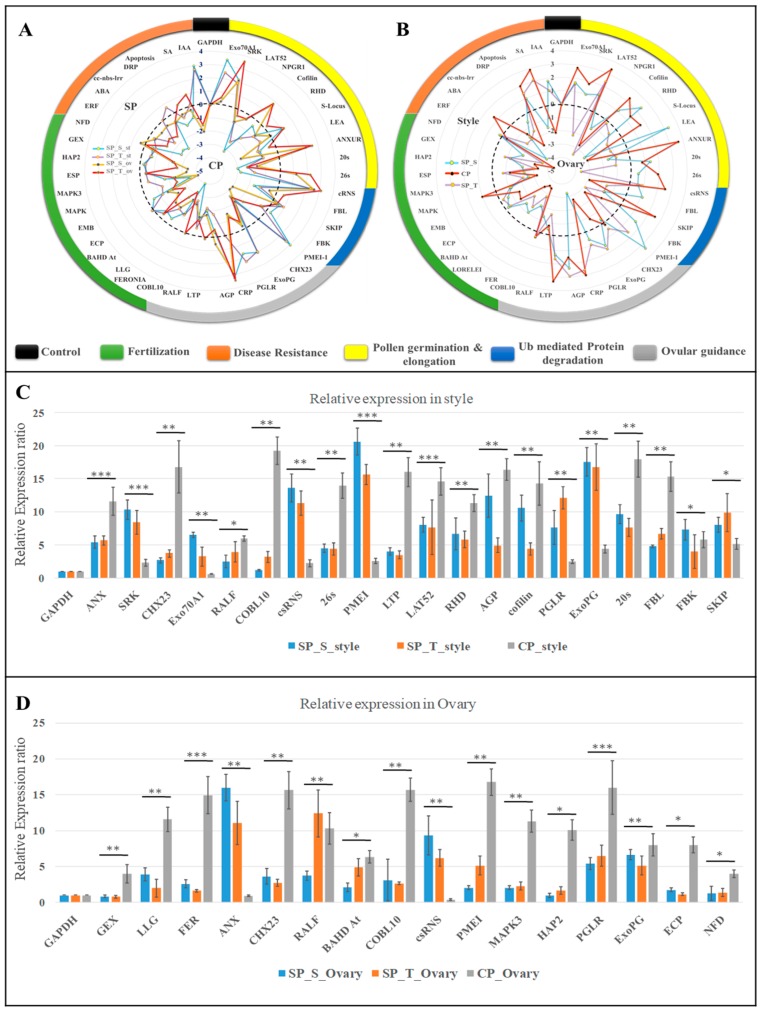
Figure 7.
qRT-PCR expression analysis (log2 fold change) of 42 key genes using GAPDH as internal control in event specific (A) and tissue specific (B) manner. The positive values (periphery) represent genes upregulated in SP and style, while negative (center) represents upregulation in CP and ovaries. (C) Significant relative expression of genes in self and cross-pollinated style and; (D) ovaries with respect to unpollinated style and ovaries respectively. The error bar in the graph represents SD of relative expression for three replicated experiments and significance level is represented as symbols (“***”, “**”, “*”) <=> p-values (0.001, 0.01, 0.05).

