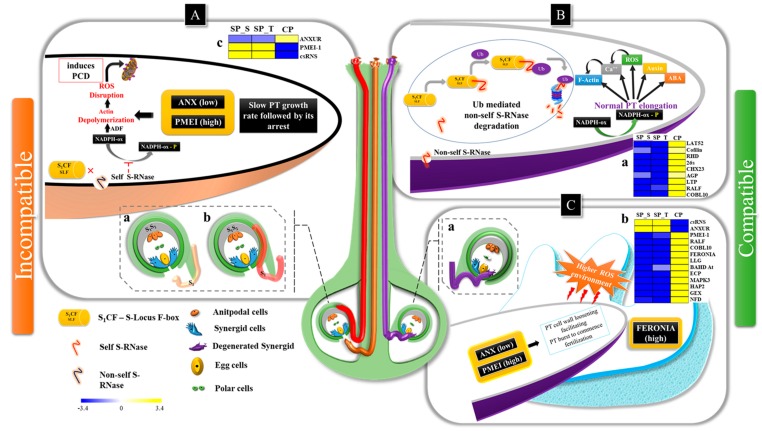
Figure 8.
Summarized illustration representing self-incompatibility and cross-compatibility with tissue specific expression. The PT elongation within self and cross-pollinated pistil [Self PT: deviated (red) and ceased (brown), cross PT fertilization (purple)]. (A) Ceased (a) and deviated pollen tubes (b) representing incompatible interactions in style; (c) Heat map showing tissue specific qPCR expression of ANXUR-rlk, PMEI and csRNS in style revealing upregulated expression (yellow) of PMEI and csRNS in both SP coupled with downregulated expression (blue) of ANXUR-rlk; The self S-RNase (csRNS) in SP style inhibits phosphorylation of NADPH-ox, resultantly inducing programmed cell death (PCD) via depolymerization of actin cytoskeleton [44] (B) Normal PT elongation in style in CP as non-self S-RNase undergoes ubiquitin mediated protein degradation [10], (a) qPCR expression pattern showing up-regulated expression of genes involved in normal PT elongation in CP style. (C) Cross PT growth arrest followed by its burst within synergids commencing fertilization (a); qPCR expression pattern (b) of PT-ovular guidance and fertilization related genes exhibiting significantly up-regulated expression in CP ovaries. The lower expression of ANX coupled with higher expression of PMEI as observed in SP_style and CP_ovary suggests their putative role in inhibiting self-PT growth in SP style leading to SI and cross-PT inhibition in CP ovary to facilitate PT burst during fertilization. The yellow-blue scale represents fold change obtained in tissue specific relative expression analysis.

