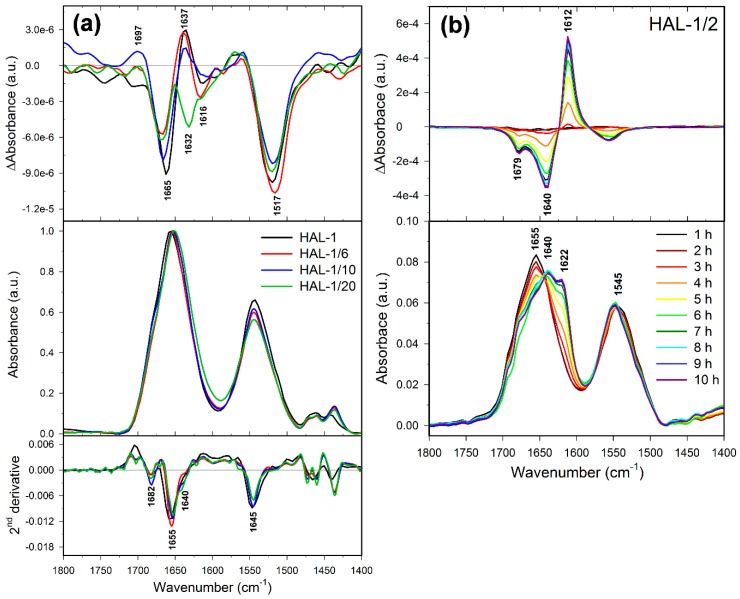
Figure 10.
(a) VCD (top)/IR (middle)/second derivatives of IR spectra (bottom) of HAL-1, HAL-1/6, HAL-1/10, and HAL-1/20 in aqueous solution for samples in the 100 mg/mL concentration; (b) time dependence (1–10 h after preparation) of VCD (top) and IR spectra (bottom) of HAL-1/2 in aqueous solution for the sample in the 100 mg/mL concentration.

