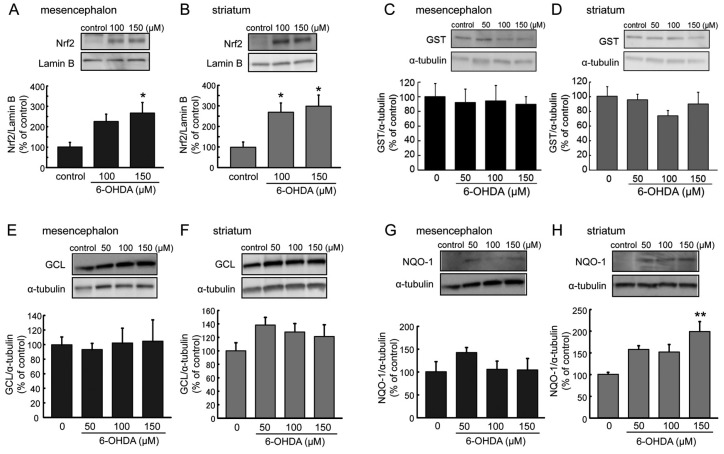
Figure 5.
(A,B) Effects of 6-OHDA treatment (100–150 µM) for 6 h on nuclear Nrf2 expression in mesencephalic (A) or striatal (B) astrocytes. Data are means ± SEM (n = 5–6); * p < 0.05 vs. control group. (C–H) Expression of glutathione S-transferase (GST) (C,D), γ-glutamyl cysteine ligase (GCL) (E,F), and quinone oxidoreductase (NQO-1) (G,H) protein in mesencephalic (C,E,G) or striatal (D,F,H) astrocytes after the treatment with 6-OHDA (50–150 µM) for 24 h. Data are means ± SEM (n = 4–6). ** p < 0.01 vs. control group.

