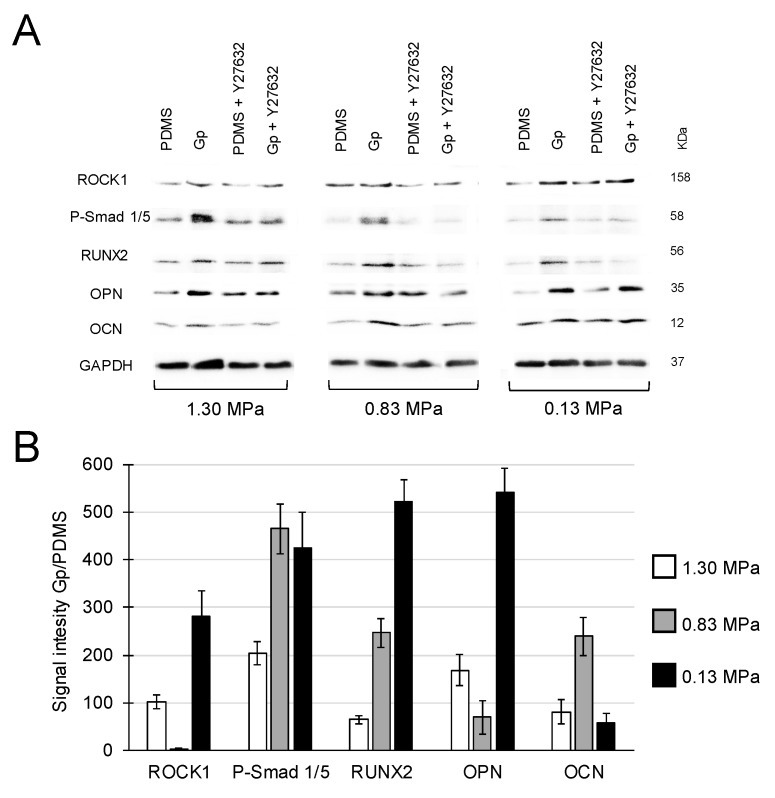
Figure 4.
(A) Regardless of the stiffness of the underlying substrate (PDMS), Gp upregulated the expression levels of ROCK1, Smad p1/5 and F-actin and bone-related proteins. With the exception of ROCK1/0.83 MPa, Gp increased the expression of all proteins by >50%. (B) Relative quantification of all groups in the absence of inhibitors. Signal intensity is in arbitrary units.

